Video-related platforms · August 2026
AI Video Traffic Report: August 2026
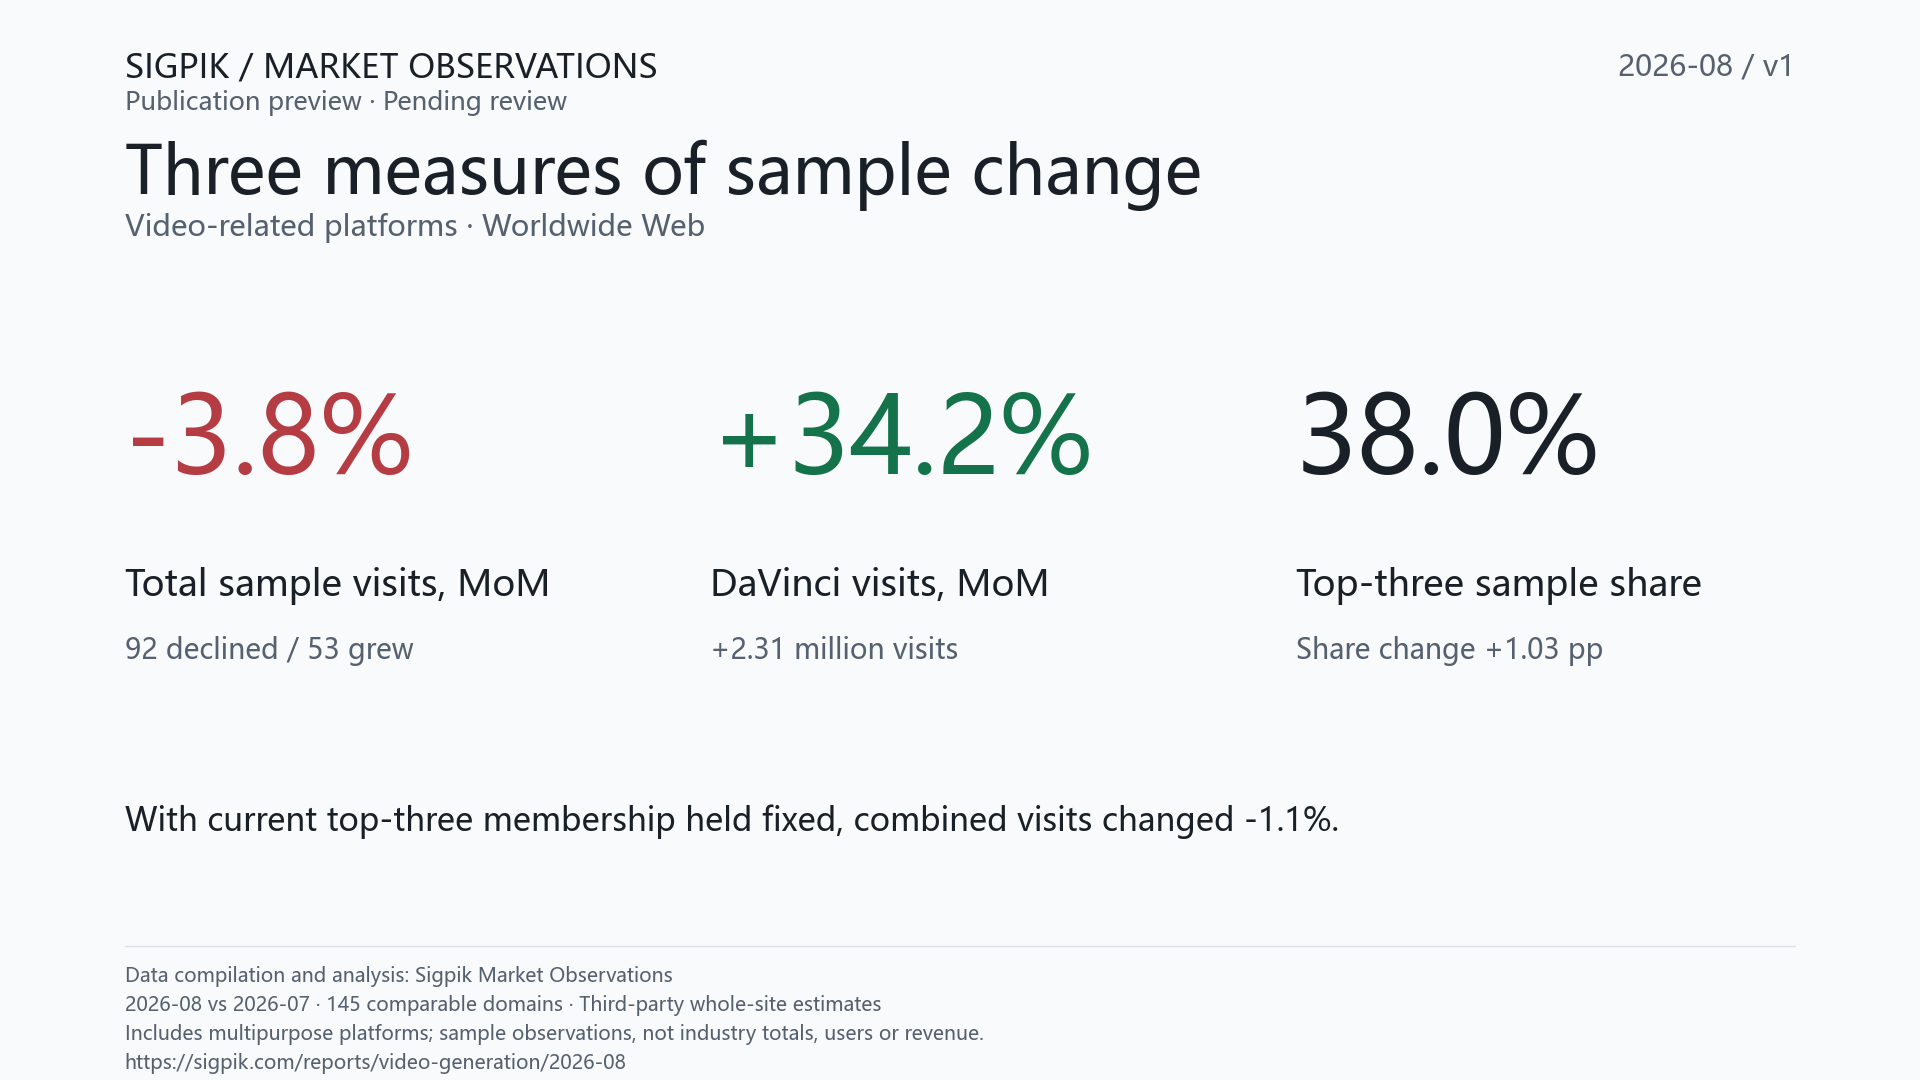
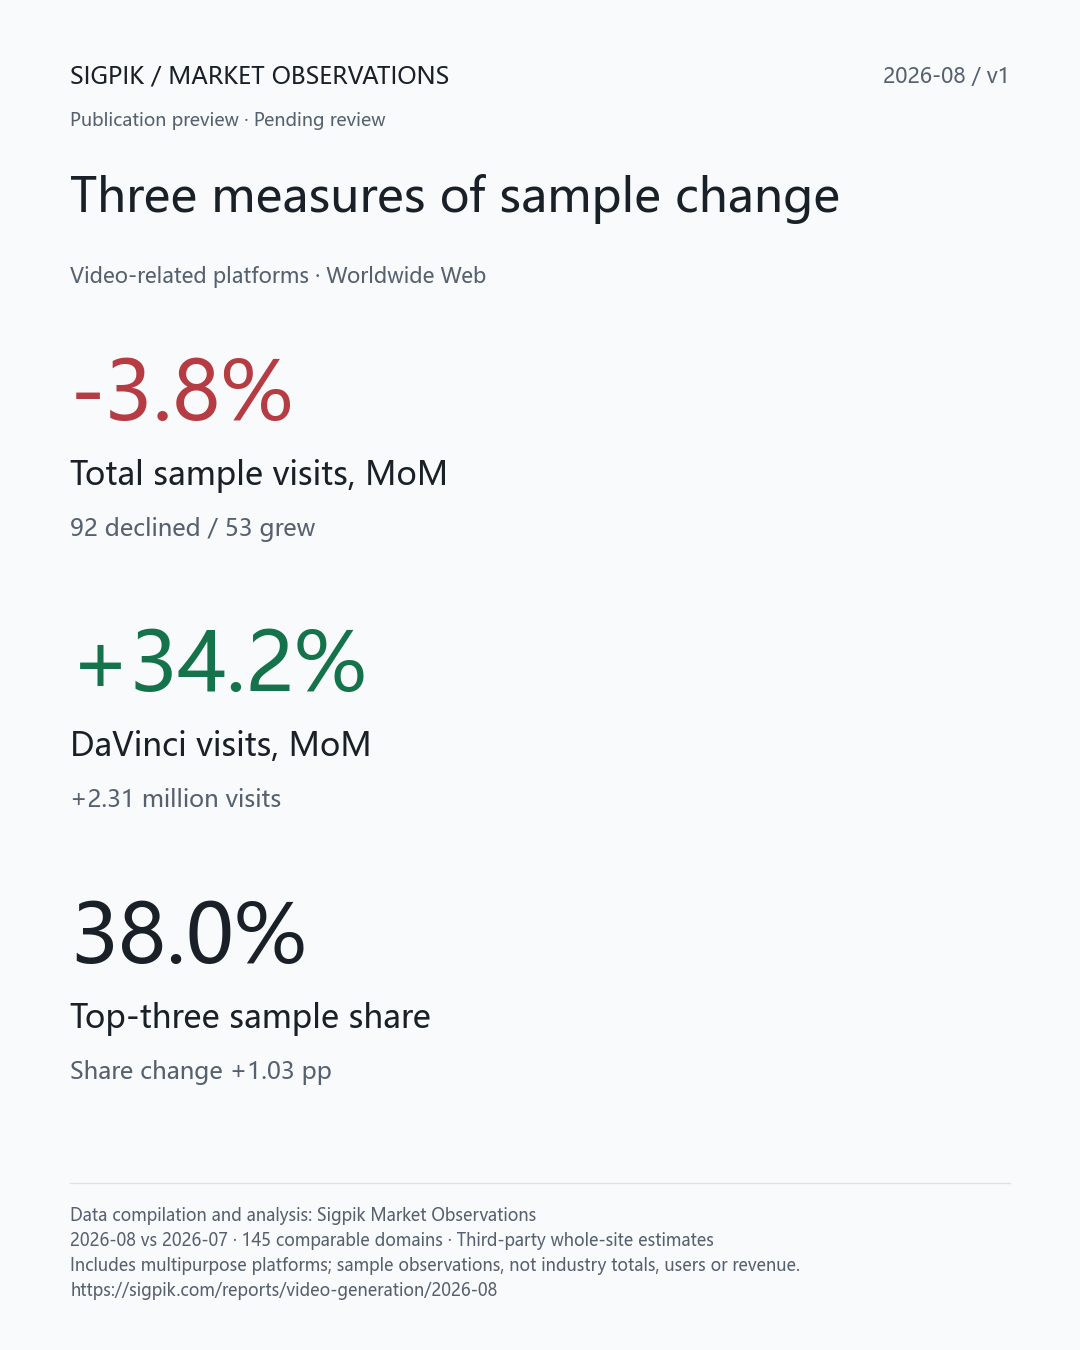
Estimated Web visits across 145 comparable samples fell 3.8% month over month; DaVinci's visits rose 34.2%.
Worldwide Web · August 2026 vs July 2026 · Estimated whole-site visits, including multipurpose platforms
01 / KEY FINDINGS
Most samples declined. Some still grew.
Most samples lost visits
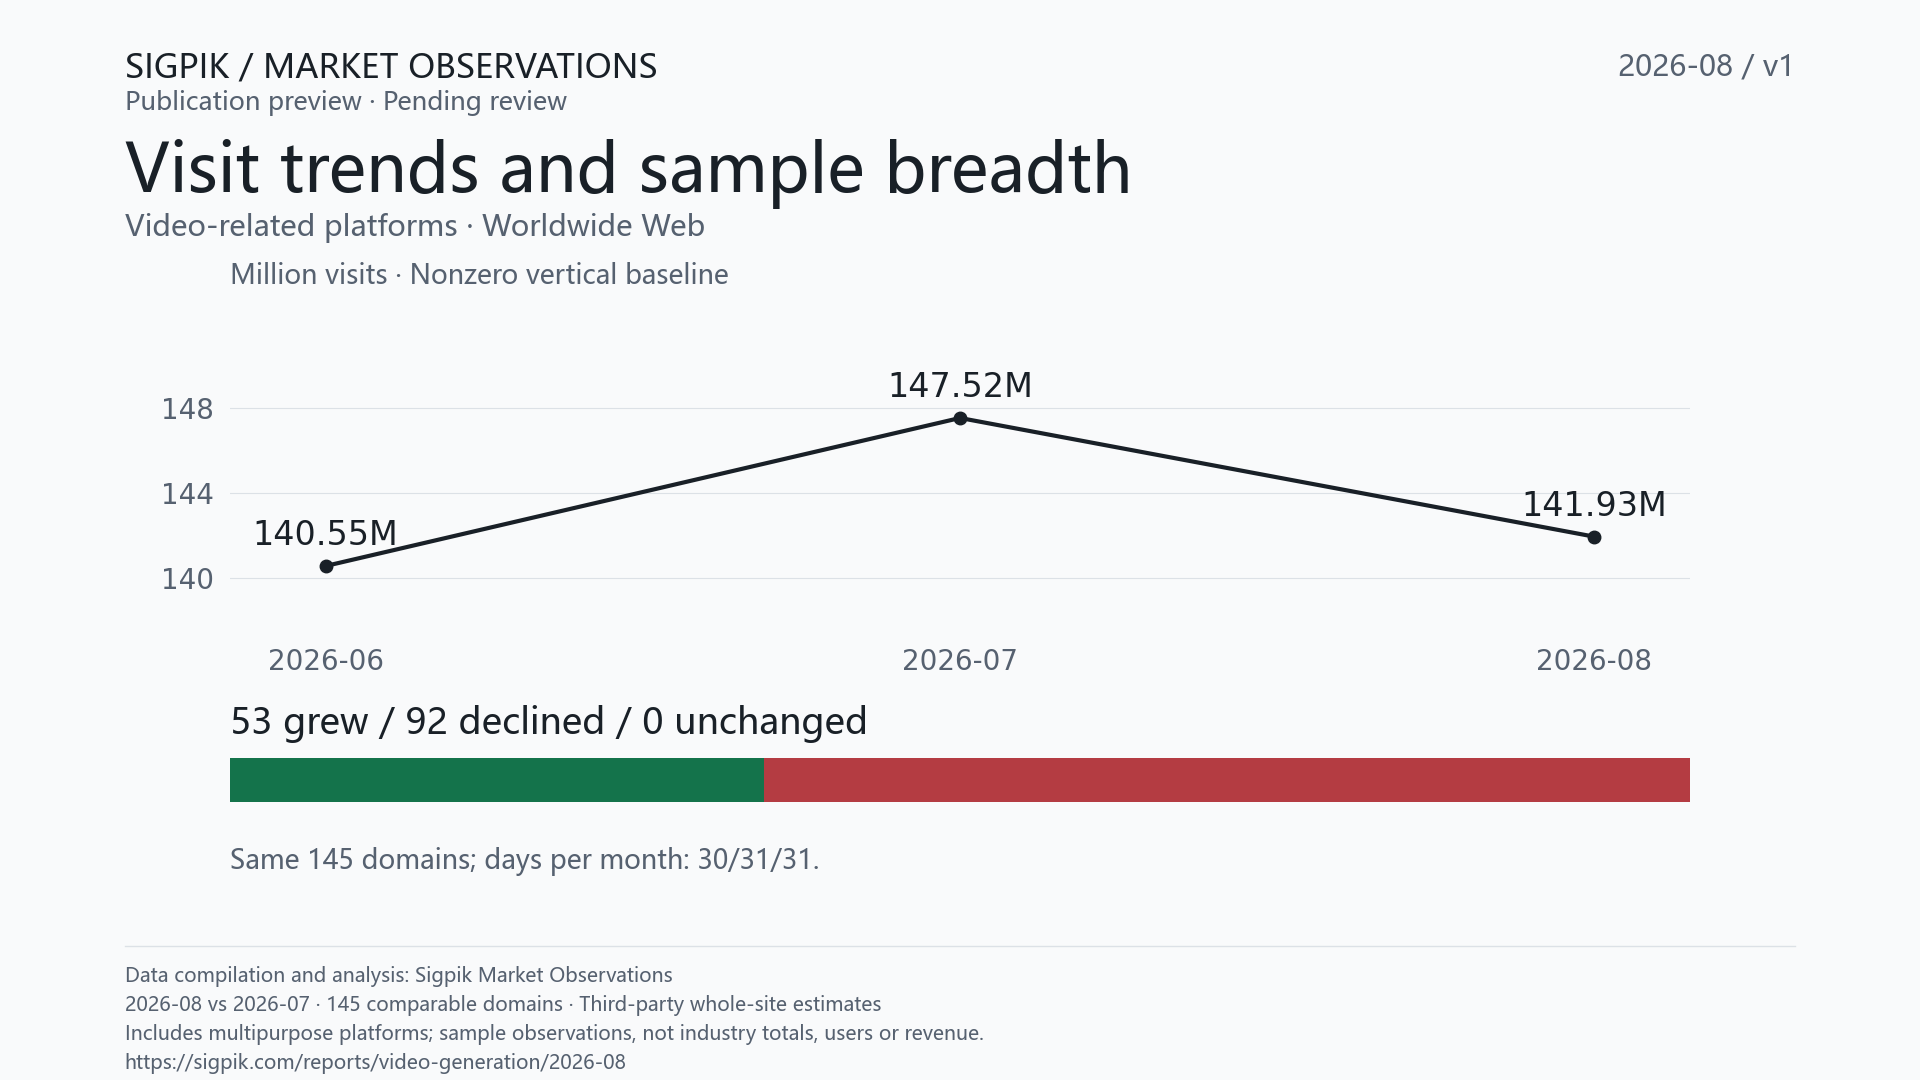
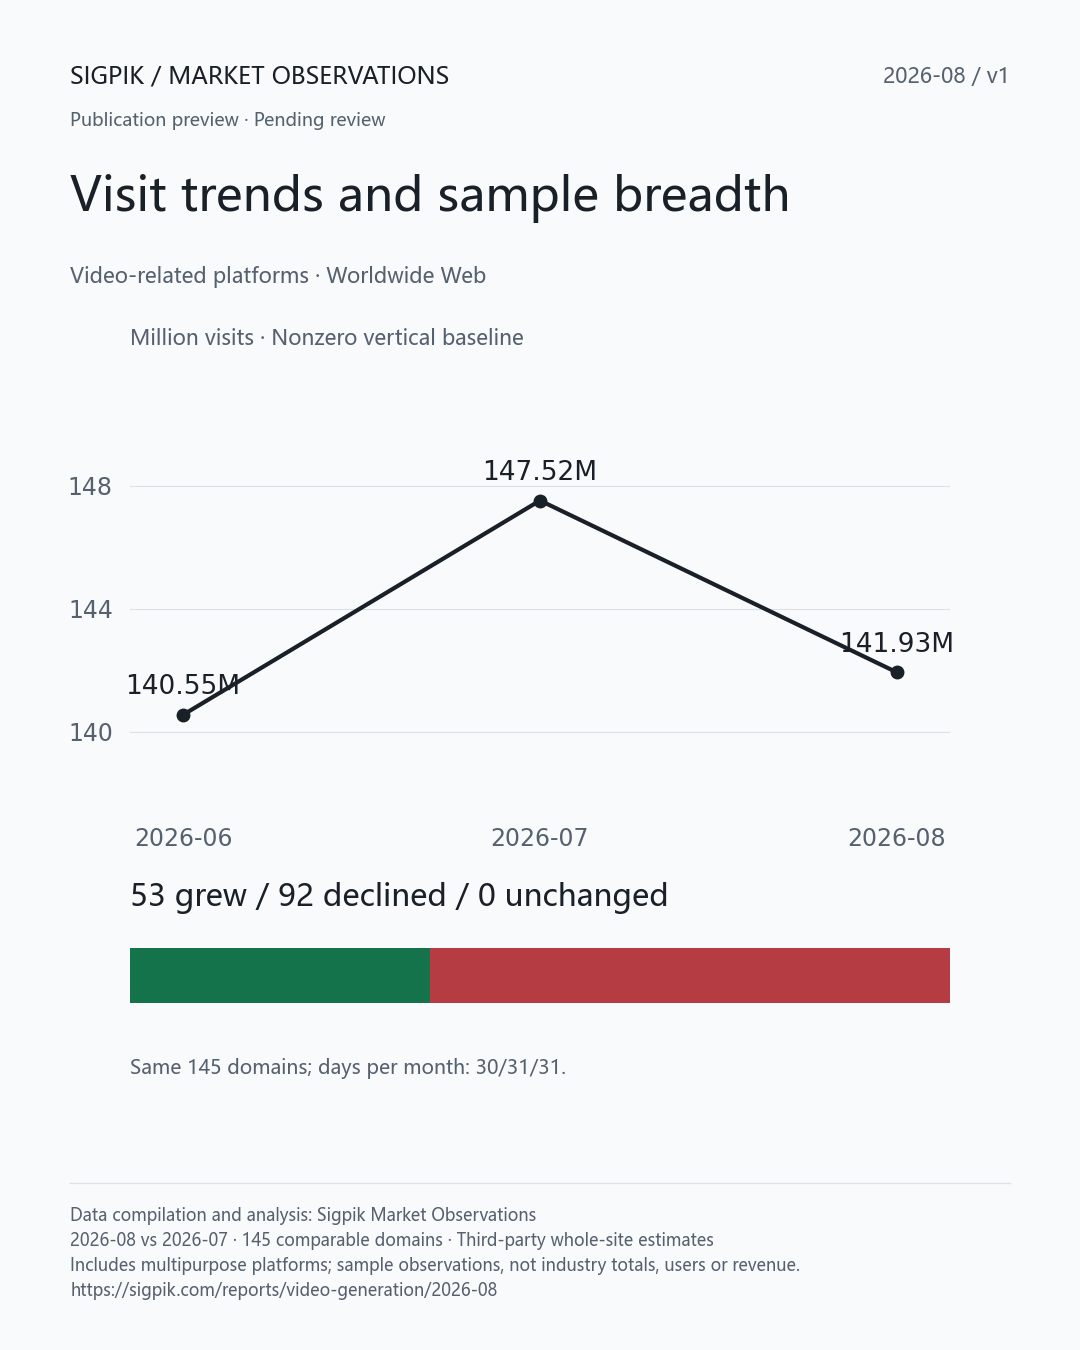
Estimated Web visits across 145 comparable video-related platforms fell 3.8% in August 2026 versus July 2026; 92 declined, 53 grew and 0 were unchanged.
DaVinci's contribution
DaVinci's estimated Web visits rose 34.2% in August 2026, adding 2.31 million visits and contributing +1.56 percentage points to sample growth.
Top-three share and visits
The top three accounted for 38.0% of sample visits in August 2026, up 1.03 percentage points; their combined visits fell 1.1% with membership held fixed.
Sample visits
141.93MWorldwide Web · estimatedMonth over month
-3.8%-5,591,548 visitsShare of samples growing
36.6%53 / 145 samplesMedian sample growth
-7.9%Equal weight per domainTop-three visit share
38.0%+1.03 percentage pointsScope: estimated worldwide whole-site Web visits across 145 comparable domains, including multipurpose platforms; sample observations, not industry totals, users or revenue.
What these changes show
53 growing domains added 4,489,062 visits; 92 declining domains lost 10,080,610 visits, for a net loss of 5,591,548 visits. Losses equal 6.83% of prior-month sample visits. Domain counts and visit volumes describe different aspects of the change.
The largest current domain, higgsfield.ai, accounts for 22.6% of sample visits. Excluding that same domain in both months, combined visits across the remaining 144 domains changed -5.5%. This separates its movement from the rest of the cohort.
These statistics identify products for further research; they do not establish causes. Product launches, promotion activity and paid conversion require additional evidence from the product timeline and other sources.
02 / CONTRIBUTORS TO CHANGE
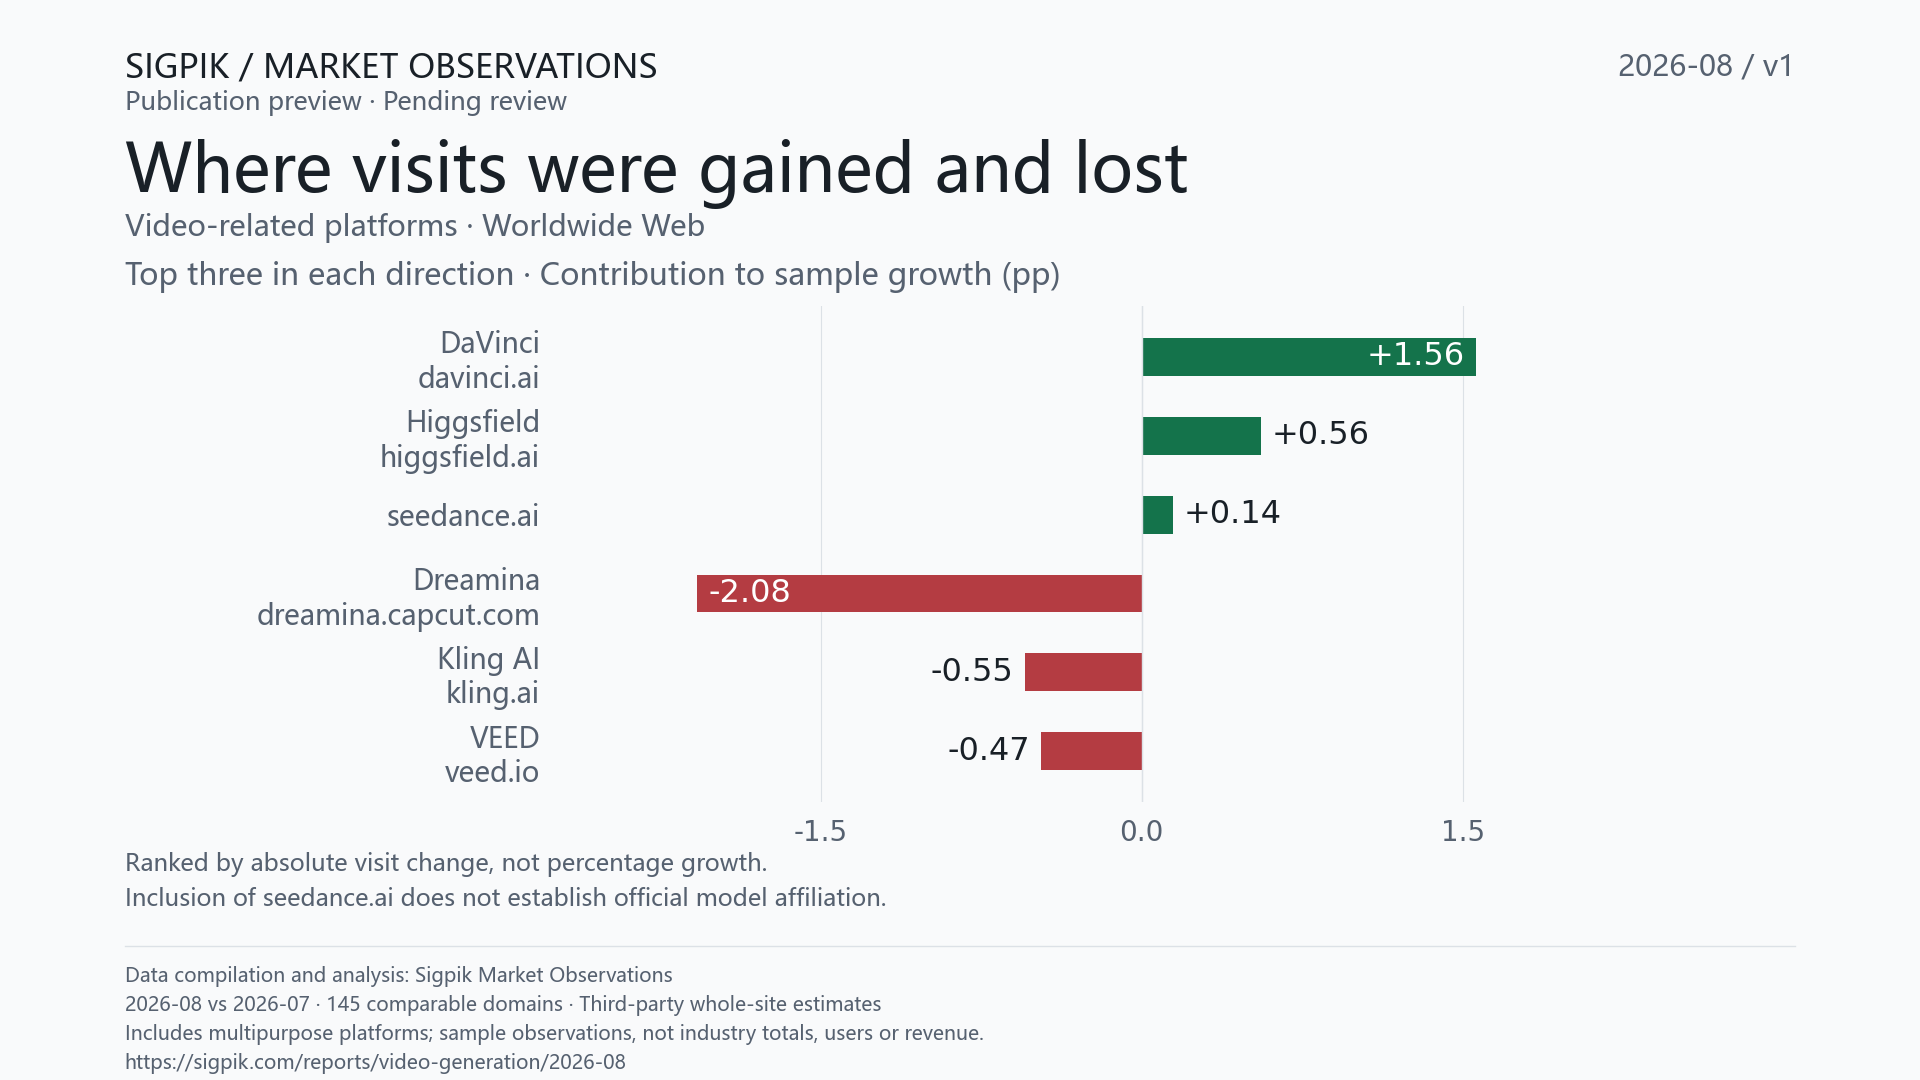
Where visits were gained and lost
Top three in each direction by absolute visit change; pp indicates contribution to overall sample growth in percentage points.
Largest positive contributions
- DaVincidavinci.ai+2,305,5656,750,185 → 9,055,750+34.2% · +1.56 pp
- Higgsfieldhiggsfield.ai+819,57931,318,735 → 32,138,314+2.6% · +0.56 pp
- seedance.ai+213,172357,727 → 570,899+59.6% · +0.14 pp
Fastest growth · Previous-month visits ≥ 100,000
- jxp.com+93,031140,131 → 233,162+66.4% · +0.06 pp
- seedance.ai+213,172357,727 → 570,899+59.6% · +0.14 pp
- DaVincidavinci.ai+2,305,5656,750,185 → 9,055,750+34.2% · +1.56 pp
seedance.ai is a domain sample; inclusion does not establish official model affiliation. Whole-site visits may include activities outside this category.
03 / TREND AND BREADTH
92 samples declined; 53 grew
Sample visits · 3 months
Same 145 domains each month. 2026-06: 30 days;2026-07: 31 days;2026-08: 31 days。Nonzero vertical baseline, in millions of visits.
Growth, decline and unchanged
Median sample growth was -7.9%. Aggregate growth reflects platform size; the distribution and median show how individual samples changed.
Direction follows the sign of the change in unrounded estimated visits; unchanged means exactly equal in both months. Small changes count toward direction, without implying statistical significance. Missing values are not treated as zero.
View all 145 comparable domains
| Domain | 2026-07 | 2026-08 | Change | MoM |
|---|---|---|---|---|
| higgsfield.ai | 31,318,735 | 32,138,314 | +819,579 | +2.6% |
| kling.ai | 12,510,056 | 11,703,445 | -806,611 | -6.4% |
| heygen.com | 10,652,352 | 10,038,702 | -613,650 | -5.8% |
| davinci.ai | 6,750,185 | 9,055,750 | +2,305,565 | +34.2% |
| openart.ai | 8,835,724 | 8,861,371 | +25,647 | +0.3% |
| veed.io | 9,169,600 | 8,474,118 | -695,482 | -7.6% |
| dreamina.capcut.com | 10,101,054 | 7,035,489 | -3,065,565 | -30.3% |
| invideo.io | 6,846,906 | 6,490,749 | -356,157 | -5.2% |
| a2e.ai | 6,240,909 | 6,277,982 | +37,073 | +0.6% |
| media.io | 4,334,702 | 3,659,935 | -674,767 | -15.6% |
| deevid.ai | 3,772,672 | 3,557,894 | -214,778 | -5.7% |
| vidu.com | 3,836,994 | 3,323,188 | -513,806 | -13.4% |
| imagine.art | 2,395,340 | 2,431,354 | +36,014 | +1.5% |
| pixelbin.io | 2,326,183 | 2,130,237 | -195,946 | -8.4% |
| vidnoz.com | 2,208,435 | 2,120,898 | -87,537 | -4.0% |
| domoai.app | 1,828,948 | 1,800,728 | -28,220 | -1.5% |
| narakeet.com | 1,681,559 | 1,556,940 | -124,619 | -7.4% |
| liblib.art | 1,731,702 | 1,545,132 | -186,570 | -10.8% |
| magiclight.ai | 848,595 | 1,032,244 | +183,649 | +21.6% |
| fliki.ai | 753,812 | 820,106 | +66,294 | +8.8% |
| flora.ai | 669,697 | 818,192 | +148,495 | +22.2% |
| hailuoai.com | 859,502 | 782,579 | -76,923 | -8.9% |
| aistudios.com | 1,134,279 | 706,901 | -427,378 | -37.7% |
| crepal.ai | 519,520 | 618,014 | +98,494 | +19.0% |
| seedance.ai | 357,727 | 570,899 | +213,172 | +59.6% |
| powtoon.com | 637,040 | 567,879 | -69,161 | -10.9% |
| veo3ai.io | 539,460 | 565,084 | +25,624 | +4.7% |
| vyond.com | 617,515 | 540,341 | -77,174 | -12.5% |
| deepfakesweb.com | 519,701 | 506,692 | -13,009 | -2.5% |
| deepdreamgenerator.com | 612,309 | 487,946 | -124,363 | -20.3% |
| revid.ai | 498,593 | 486,122 | -12,471 | -2.5% |
| dreamfaceapp.com | 621,123 | 480,395 | -140,728 | -22.7% |
| clipfly.ai | 504,538 | 437,872 | -66,666 | -13.2% |
| morphstudio.com | 601,100 | 411,726 | -189,374 | -31.5% |
| getimg.ai | 340,103 | 395,709 | +55,606 | +16.3% |
| litmedia.ai | 342,997 | 330,509 | -12,488 | -3.6% |
| fineshare.com | 314,536 | 318,380 | +3,844 | +1.2% |
| roboneo.com | 306,356 | 315,816 | +9,460 | +3.1% |
| vidful.ai | 346,559 | 309,823 | -36,736 | -10.6% |
| gstory.ai | 299,774 | 292,208 | -7,566 | -2.5% |
| trupeer.ai | 267,316 | 285,476 | +18,160 | +6.8% |
| basedlabs.ai | 291,124 | 274,984 | -16,140 | -5.5% |
| viyou.ai | 305,979 | 274,644 | -31,335 | -10.2% |
| sellerpic.ai | 269,497 | 256,322 | -13,175 | -4.9% |
| steve.ai | 301,997 | 250,796 | -51,201 | -17.0% |
| vidwud.com | 418,900 | 245,996 | -172,904 | -41.3% |
| videogen.io | 231,981 | 245,192 | +13,211 | +5.7% |
| vadoo.tv | 226,015 | 242,569 | +16,554 | +7.3% |
| hera.video | 316,120 | 240,338 | -75,782 | -24.0% |
| yapper.so | 287,857 | 235,929 | -51,928 | -18.0% |
| mootion.com | 296,501 | 235,911 | -60,590 | -20.4% |
| wavel.ai | 217,893 | 233,830 | +15,937 | +7.3% |
| jxp.com | 140,131 | 233,162 | +93,031 | +66.4% |
| loova.ai | 177,796 | 211,595 | +33,799 | +19.0% |
| bigmotion.ai | 217,862 | 205,483 | -12,379 | -5.7% |
| picwand.ai | 223,444 | 201,272 | -22,172 | -9.9% |
| focalml.com | 233,448 | 192,153 | -41,295 | -17.7% |
| lumen5.com | 209,521 | 178,527 | -30,994 | -14.8% |
| dezgo.com | 192,314 | 176,668 | -15,646 | -8.1% |
| vireels.ai | 150,724 | 175,228 | +24,504 | +16.3% |
| onemoreshot.ai | 176,594 | 167,525 | -9,069 | -5.1% |
| zebracat.ai | 248,846 | 167,381 | -81,465 | -32.7% |
| pixnova.ai | 182,432 | 165,388 | -17,044 | -9.3% |
| visla.us | 175,790 | 150,948 | -24,842 | -14.1% |
| motionvid.ai | 148,732 | 149,882 | +1,150 | +0.8% |
| wondercraft.ai | 143,152 | 135,742 | -7,410 | -5.2% |
| sendfame.com | 110,463 | 115,302 | +4,839 | +4.4% |
| videotok.app | 113,390 | 114,350 | +960 | +0.8% |
| aicut.pro | 132,915 | 112,301 | -20,614 | -15.5% |
| storyboarder.ai | 178,749 | 112,298 | -66,451 | -37.2% |
| vsub.io | 96,360 | 104,903 | +8,543 | +8.9% |
| weryai.com | 178,297 | 103,098 | -75,199 | -42.2% |
| knowlify.com | 50,354 | 98,734 | +48,380 | +96.1% |
| tomoviee.ai | 98,913 | 87,118 | -11,795 | -11.9% |
| vexub.com | 89,850 | 82,069 | -7,781 | -8.7% |
| elai.io | 107,836 | 77,770 | -30,066 | -27.9% |
| vidflux.ai | 90,354 | 77,027 | -13,327 | -14.7% |
| gliacloud.com | 99,238 | 75,029 | -24,209 | -24.4% |
| synthesys.io | 108,424 | 74,113 | -34,311 | -31.6% |
| melies.co | 83,793 | 72,761 | -11,032 | -13.2% |
| zorqai.com | 88,655 | 68,739 | -19,916 | -22.5% |
| intellemo.ai | 25,967 | 64,420 | +38,453 | +148.1% |
| maxstudio.ai | 99,538 | 62,195 | -37,343 | -37.5% |
| genra.ai | 49,310 | 57,008 | +7,698 | +15.6% |
| xmk.com | 50,656 | 56,341 | +5,685 | +11.2% |
| mixhubai.com | 58,633 | 50,489 | -8,144 | -13.9% |
| fetra.ai | 2,557 | 41,173 | +38,616 | +1510.2% |
| lensgo.ai | 67,502 | 40,905 | -26,597 | -39.4% |
| dreamlux.ai | 51,124 | 38,553 | -12,571 | -24.6% |
| ai-inspo.com | 26,242 | 38,417 | +12,175 | +46.4% |
| waymark.com | 43,039 | 37,498 | -5,541 | -12.9% |
| genbaz.io | 32,768 | 34,969 | +2,201 | +6.7% |
| queststudio.io | 22,725 | 31,998 | +9,273 | +40.8% |
| waverai.app | 28,670 | 31,611 | +2,941 | +10.3% |
| korpi.ai | 48,189 | 29,033 | -19,156 | -39.8% |
| plotparty.ai | 6,102 | 28,068 | +21,966 | +360.0% |
| aibabydance.com | 16,288 | 27,005 | +10,717 | +65.8% |
| omnivideo.net | 22,459 | 25,971 | +3,512 | +15.6% |
| zopia.ai | 23,873 | 23,867 | -6 | -0.0% |
| usevelo.ai | 19,390 | 22,383 | +2,993 | +15.4% |
| shortmake.com | 13,463 | 20,739 | +7,276 | +54.0% |
| boolv.video | 28,164 | 19,973 | -8,191 | -29.1% |
| vidnix.ai | 19,417 | 19,654 | +237 | +1.2% |
| dream-machine-ai.com | 26,182 | 19,434 | -6,748 | -25.8% |
| ailensgo.com | 10,699 | 19,090 | +8,391 | +78.4% |
| martini.film | 23,490 | 17,563 | -5,927 | -25.2% |
| oldphoto.ai | 21,349 | 15,750 | -5,599 | -26.2% |
| kontext-ai.com | 17,792 | 13,322 | -4,470 | -25.1% |
| cococlip.ai | 12,571 | 12,215 | -356 | -2.8% |
| clipzap.ai | 18,630 | 12,179 | -6,451 | -34.6% |
| flickify.com | 10,092 | 10,672 | +580 | +5.7% |
| gan.studio | 24,687 | 10,634 | -14,053 | -56.9% |
| freesoragenerator.com | 10,723 | 9,876 | -847 | -7.9% |
| wzrd.ai | 8,450 | 9,489 | +1,039 | +12.3% |
| karavideo.ai | 14,177 | 7,982 | -6,195 | -43.7% |
| wowto.ai | 8,514 | 7,124 | -1,390 | -16.3% |
| joyspace.ai | 4,189 | 5,852 | +1,663 | +39.7% |
| happy-horse.ai | 10,005 | 5,847 | -4,158 | -41.6% |
| shuffll.com | 8,297 | 5,104 | -3,193 | -38.5% |
| rawshorts.com | 3,454 | 5,004 | +1,550 | +44.9% |
| aipai.ai | 4,321 | 4,513 | +192 | +4.4% |
| beatwaveapp.com | 4,993 | 3,916 | -1,077 | -21.6% |
| toolplay.ai | 3,659 | 3,082 | -577 | -15.8% |
| baz.studio | 3,631 | 2,970 | -661 | -18.2% |
| deeplive.cam | 11,146 | 2,365 | -8,781 | -78.8% |
| vimerse.app | 3,513 | 2,238 | -1,275 | -36.3% |
| casablanca.ai | 9,001 | 1,851 | -7,150 | -79.4% |
| temvideo.ai | 285 | 1,794 | +1,509 | +529.5% |
| productvideo.ai | 1,459 | 1,756 | +297 | +20.4% |
| filmforge.uwu.ai | 3,572 | 1,456 | -2,116 | -59.2% |
| seedance.com.ai | 415 | 1,408 | +993 | +239.3% |
| ray32.net | 392 | 1,326 | +934 | +238.3% |
| filmpire.app | 1,294 | 1,020 | -274 | -21.2% |
| muse-video.app | 881 | 893 | +12 | +1.4% |
| speedpaint.io | 588 | 814 | +226 | +38.4% |
| videoall.ai | 338 | 687 | +349 | +103.3% |
| rotopus.art | 2,180 | 661 | -1,519 | -69.7% |
| veesual.ai | 3,557 | 626 | -2,931 | -82.4% |
| clipstudios.ai | 2,874 | 609 | -2,265 | -78.8% |
| snowpixel.app | 1,179 | 445 | -734 | -62.3% |
| charactr.com | 1,583 | 387 | -1,196 | -75.6% |
| prismaudio.net | 2,384 | 362 | -2,022 | -84.8% |
| openclips.ai | 1,292 | 133 | -1,159 | -89.7% |
| aiisajoke.com | 1,115 | 39 | -1,076 | -96.5% |
| veggieai.net | 1,044 | 0 | -1,044 | -100.0% |
04 / MEDIA RESOURCES
Copy the findings. Take the charts.
No sign-in required. All downloads use the same edition and methodology as this report.
Exported charts are light-background PNGs for articles and reports. Landscape: 1920×1080; portrait: 1080×1350.
According to Sigpik Market Observations, estimated Web visits across 145 comparable video-related platforms fell 3.8% in August 2026 versus July 2026; 92 declined, 53 grew and 0 were unchanged.
According to Sigpik Market Observations, DaVinci's estimated Web visits rose 34.2% in August 2026, adding 2.31 million visits and contributing +1.56 percentage points to sample growth.
According to Sigpik Market Observations, the top three accounted for 38.0% of sample visits in August 2026, up 1.03 percentage points; their combined visits fell 1.1% with membership held fixed.
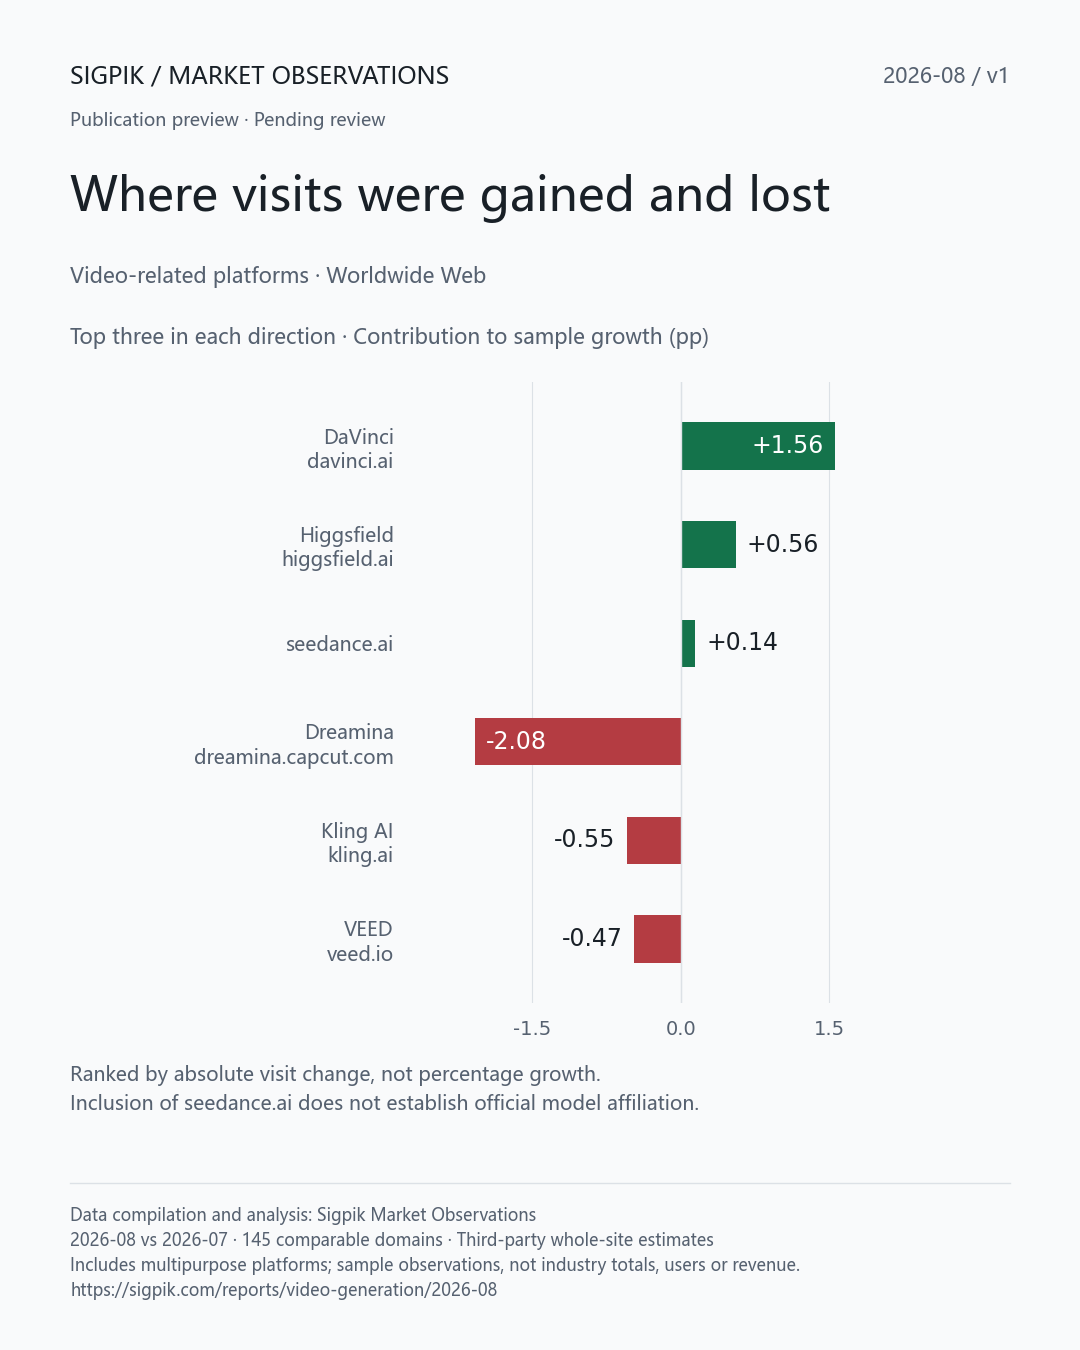
Includes 6 PNGs, summary.csv, cohort.csv, coverage.json, citation.txt and README.txt. Retain Sigpik attribution, period, sample scope and the edition link when citing.
Get the Sigpik monthly research brief →
Coverage in this edition
The candidate set contains 169 domains; 145 meet the two-month comparison rules and 24 are excluded by data conditions.
Comparable samples account for 99.992% of observed current-month visits in the candidate set. This is not 99.992% coverage of the entire market.
- Missing valid current-month visits. 0 domains
- Missing valid previous-month visits. 0 domains
- Zero previous-month visits; comparable growth cannot be calculated. 24 domains
Notable coverage gaps
- runwayml.com:Outside this edition’s category candidate set. Catalog, classification or domain-change reasons remain unverified; this is separate from data exclusions.
Samples follow a category snapshot, not an exhaustive market roster. Multipurpose platforms use whole-site visits; absence does not mean zero traffic or exclusion from the market.
05 / METHODOLOGY
How to read these numbers
Data compilation and analysis: Sigpik Market Observations. Third-party estimates for covered video-related platforms are deduplicated by domain. Figures represent worldwide whole-site Web visits, including multipurpose platforms; they do not separately measure app, API or off-site use and are not unique users.
Comparable samples, calculations and ranking rules
- Comparable samples: 145 domains with valid visits in both months and a positive baseline. Historical trends use the same domains.
- Overall growth = sum of current visits / sum of previous visits − 1. Median growth uses individual domain growth rates.
- Contribution = domain visit change / previous sample total × 100, in percentage points. Main lists rank visit change; the growth list requires at least 100,000 previous-month visits.
- Top-three share uses each month’s three largest domains. Top-three visit growth compares the current top three across both months.
- Shares are within the sample. A single month cannot establish revenue changes or competitive causality. Cohorts may change between editions; catalog additions do not recalculate historical editions.
Prepared: 2026-09-10 · Version: v1 · Publication preview。Published editions stay fixed; corrections retain the original version and a visible explanation.