Music-related platforms · August 2026
AI Music Traffic Report: August 2026
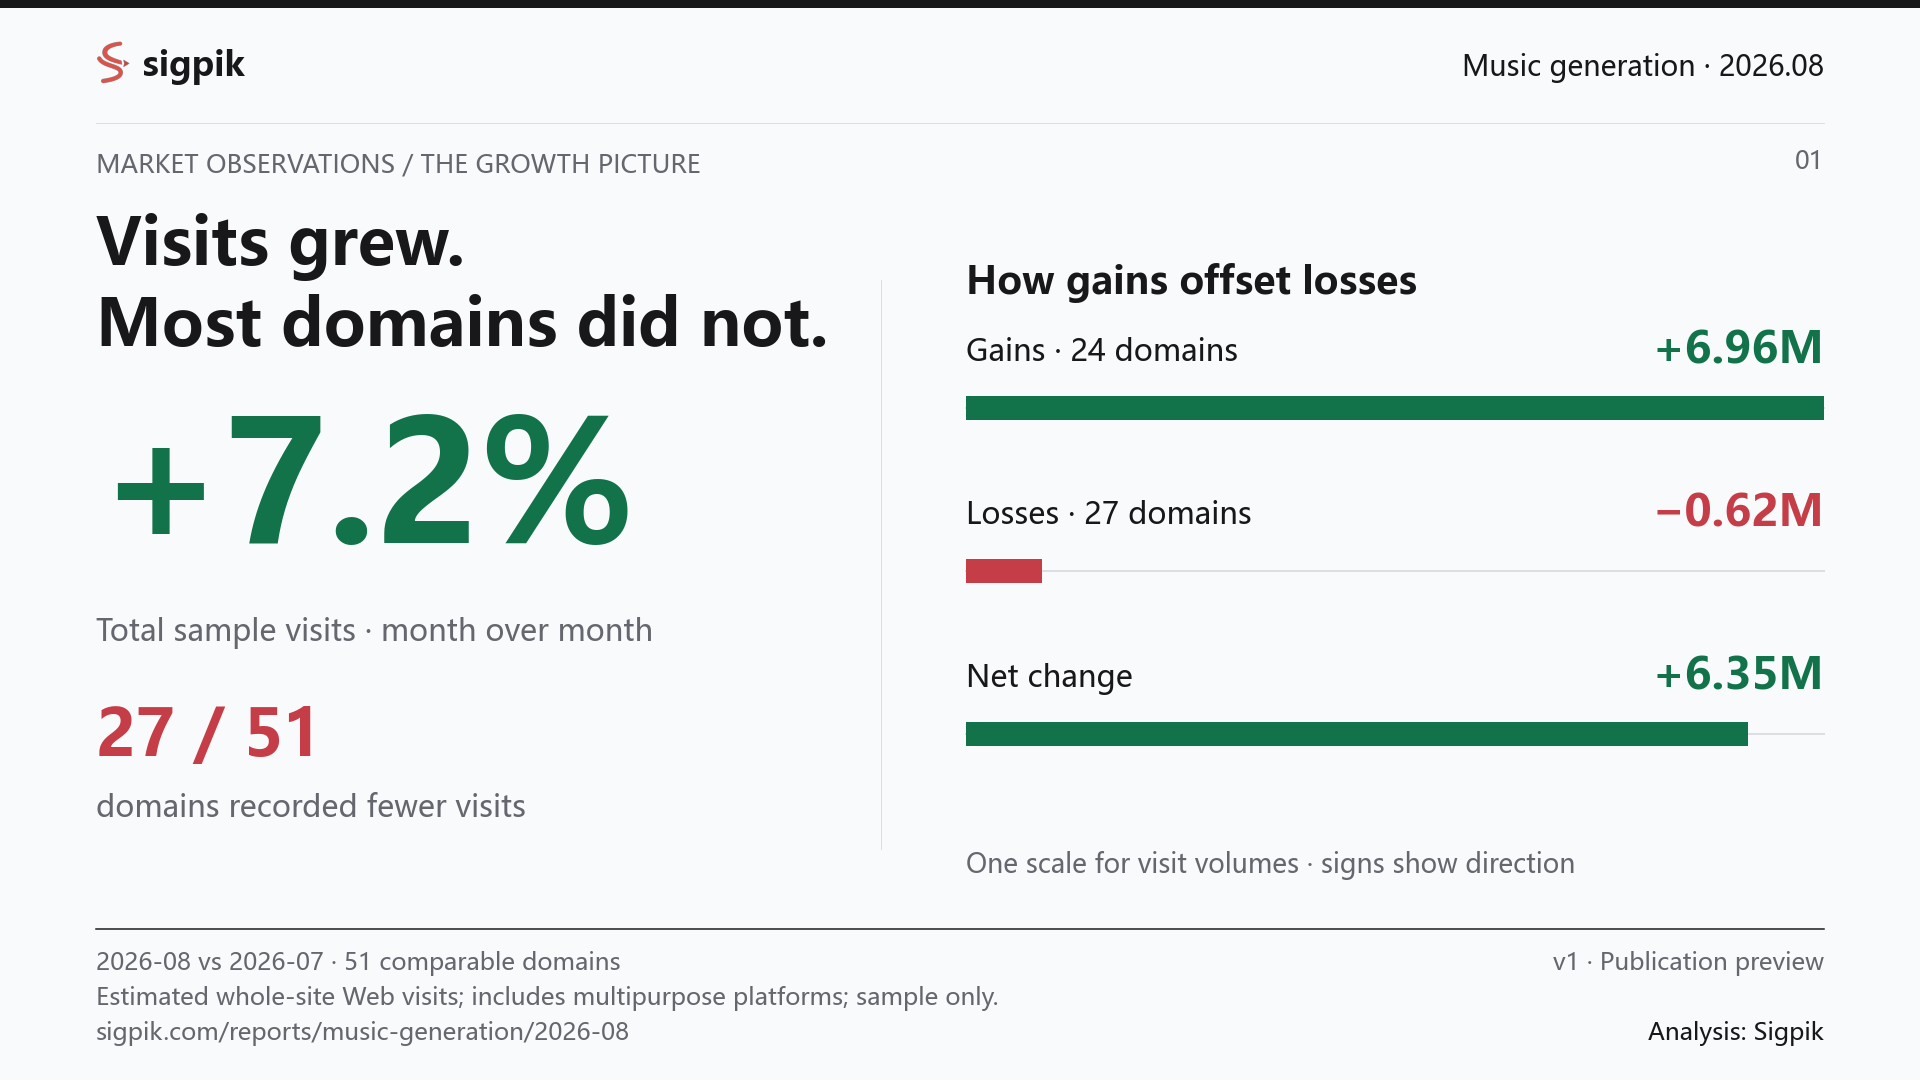
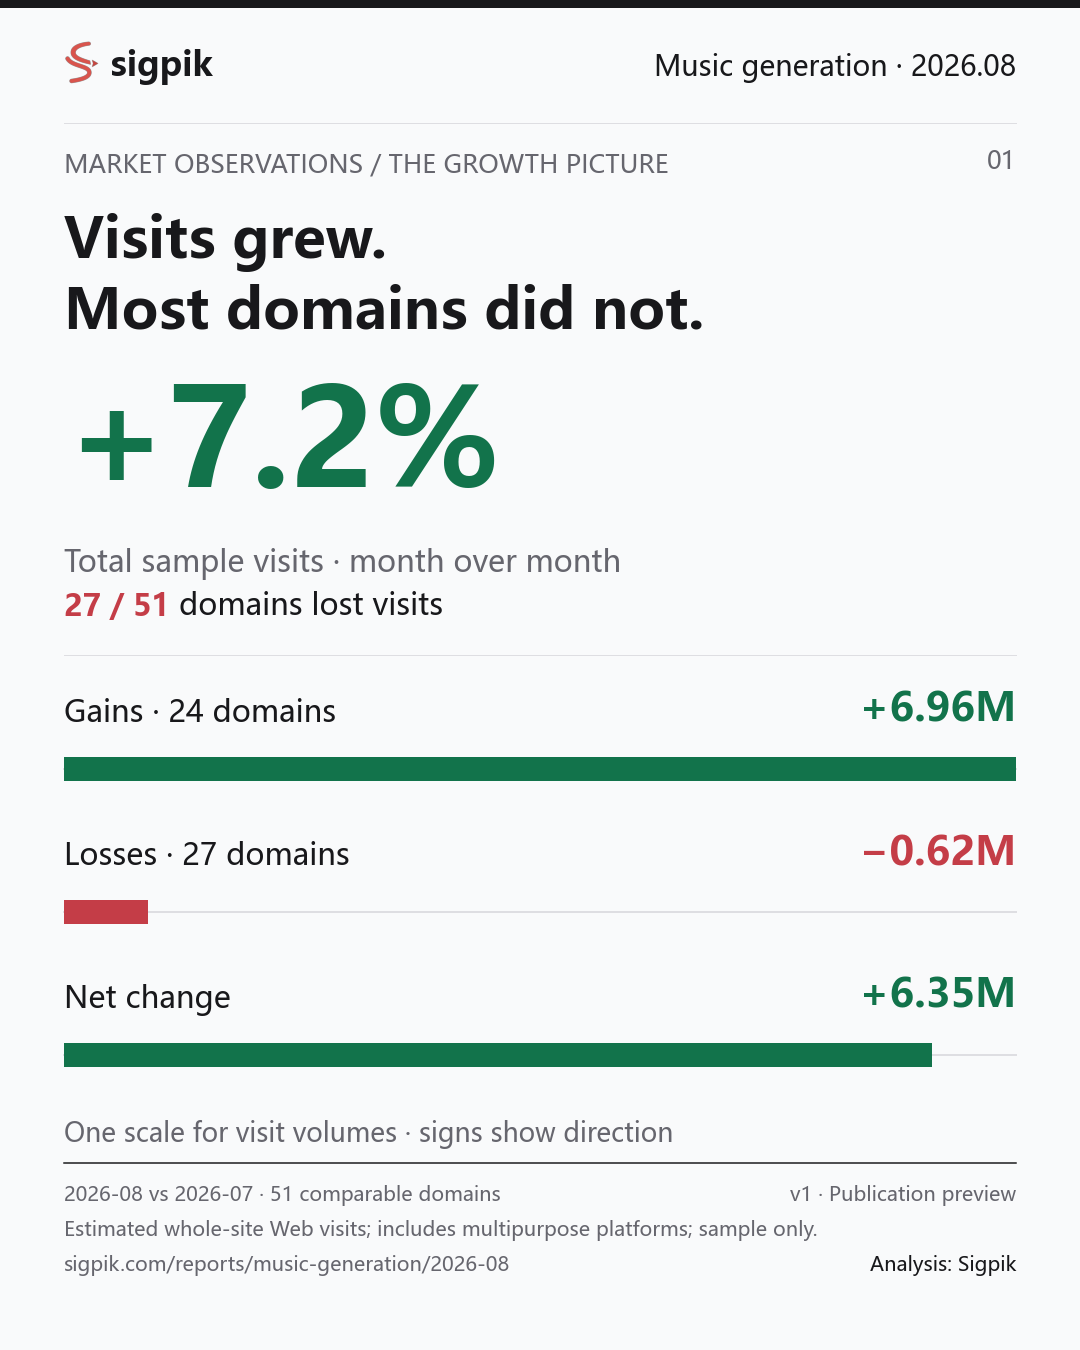
Estimated Web visits across 51 comparable samples rose 7.2% month over month. 24 growing domains added 6,964,010 visits; 27 declining domains lost 616,733 visits, for a net gain of 6,347,277 visits.
Worldwide Web · August 2026 vs July 2026 · Estimated whole-site visits, including multipurpose platforms
01 / KEY FINDINGS
Visit gains, losses and the net change
Visit gains and losses
Estimated Web visits across 51 comparable domains rose 7.2% in August 2026. 24 growing domains added 6,964,010 visits; 27 declining domains lost 616,733 visits, for a net gain of 6,347,277 visits.
Flow Music’s contribution
Flow Music's estimated Web visits rose 105.2% in August 2026, adding 3.17 million visits and contributing +3.61 percentage points to sample growth.
Largest domain and remaining sample
Suno accounted for 77.2% of estimated sample Web visits in August 2026. Excluding that domain in both months, visits across the remaining 50 domains rose 27.3%. Median growth across all 51 domains was -7.4%.
Sample visits
94.19MWorldwide Web · estimatedVisits gained
+6.96M24 growing domainsVisits lost
−0.62M27 domains · 0.70% of prior totalNet month-over-month change
+7.2%+6,347,277 visitsMedian sample growth
-7.4%Equal weight per domainScope: estimated worldwide whole-site Web visits across 51 comparable domains, including multipurpose platforms; sample observations, not industry totals, users or revenue.
What these changes show
24 growing domains added 6,964,010 visits; 27 declining domains lost 616,733 visits, for a net gain of 6,347,277 visits. Losses equal 0.70% of prior-month sample visits. Domain counts and visit volumes describe different aspects of the change.
The largest current domain, suno.com, accounts for 77.2% of sample visits. Excluding that same domain in both months, combined visits across the remaining 50 domains changed +27.3%. This separates its movement from the rest of the cohort.
These statistics identify products for further research; they do not establish causes. Product launches, promotion activity and paid conversion require additional evidence from the product timeline and other sources.
02 / CONTRIBUTORS TO CHANGE
Where visits were gained and lost
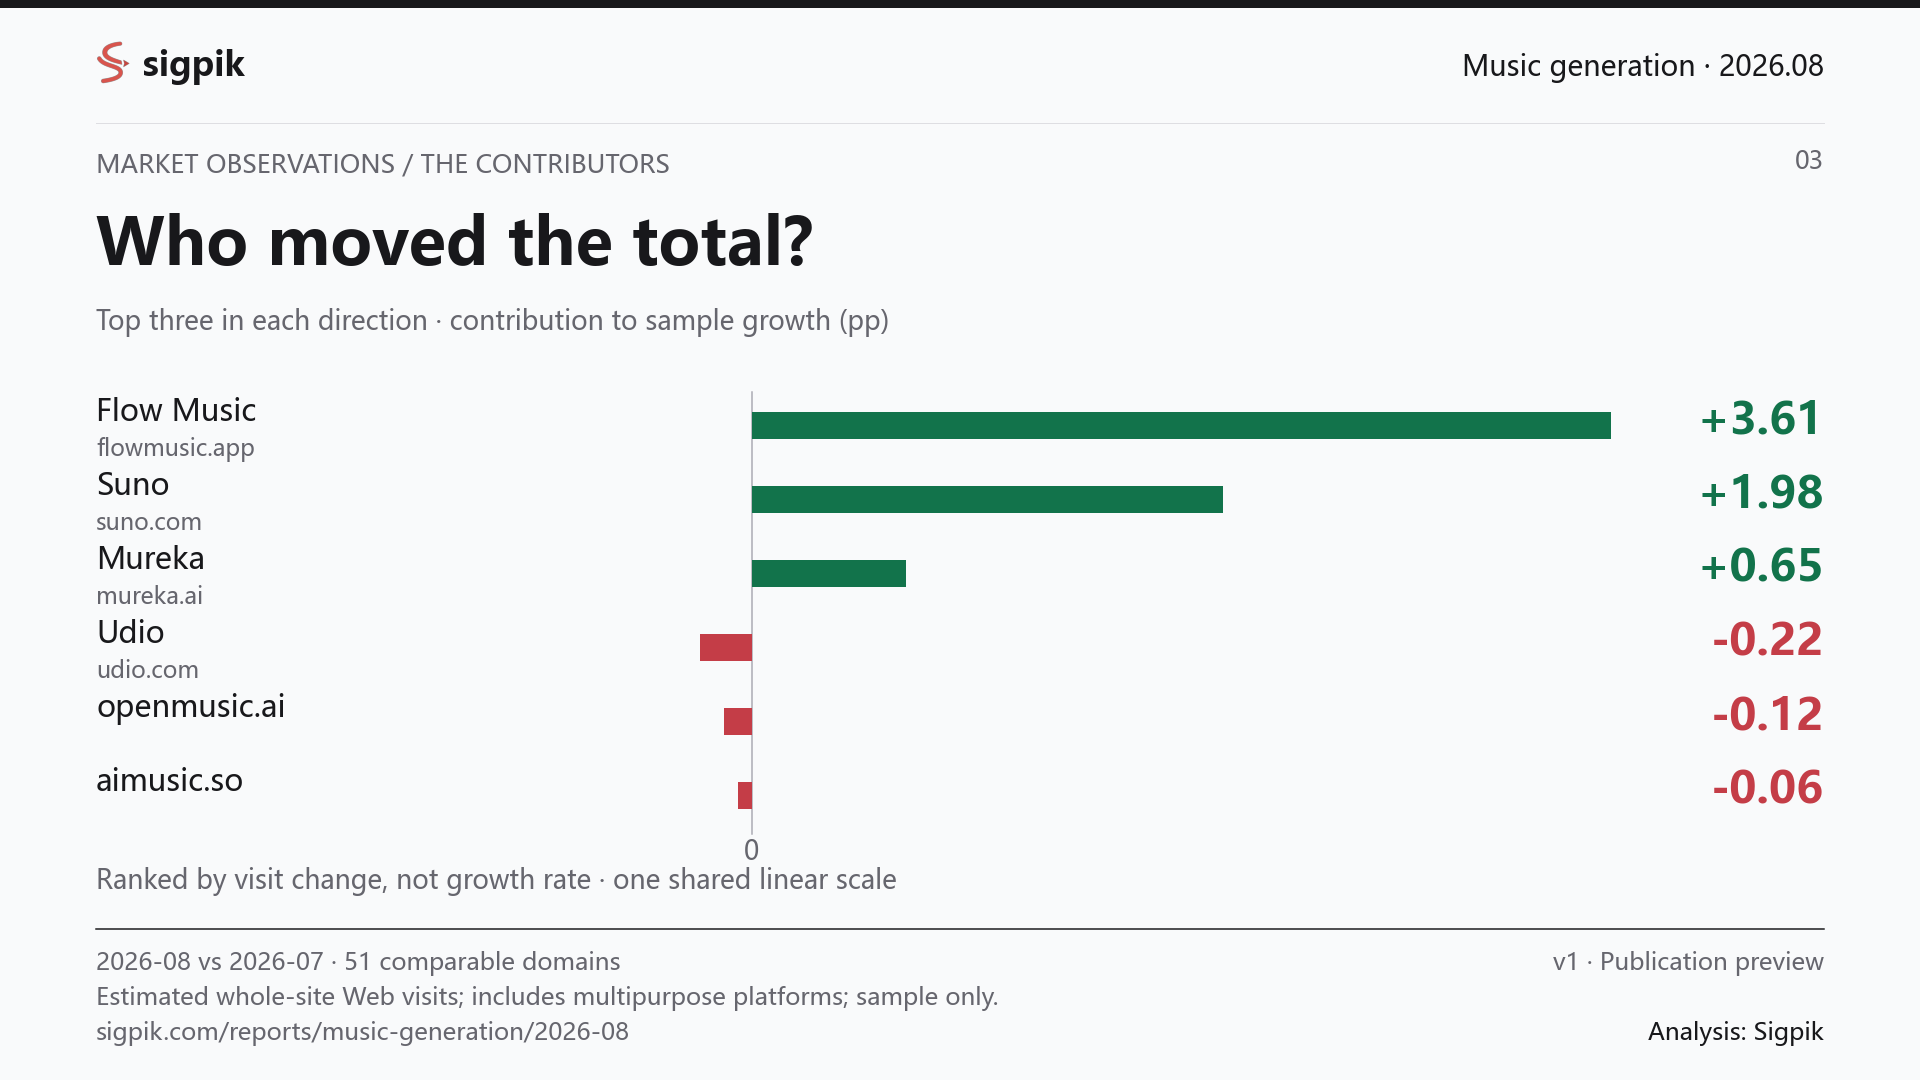
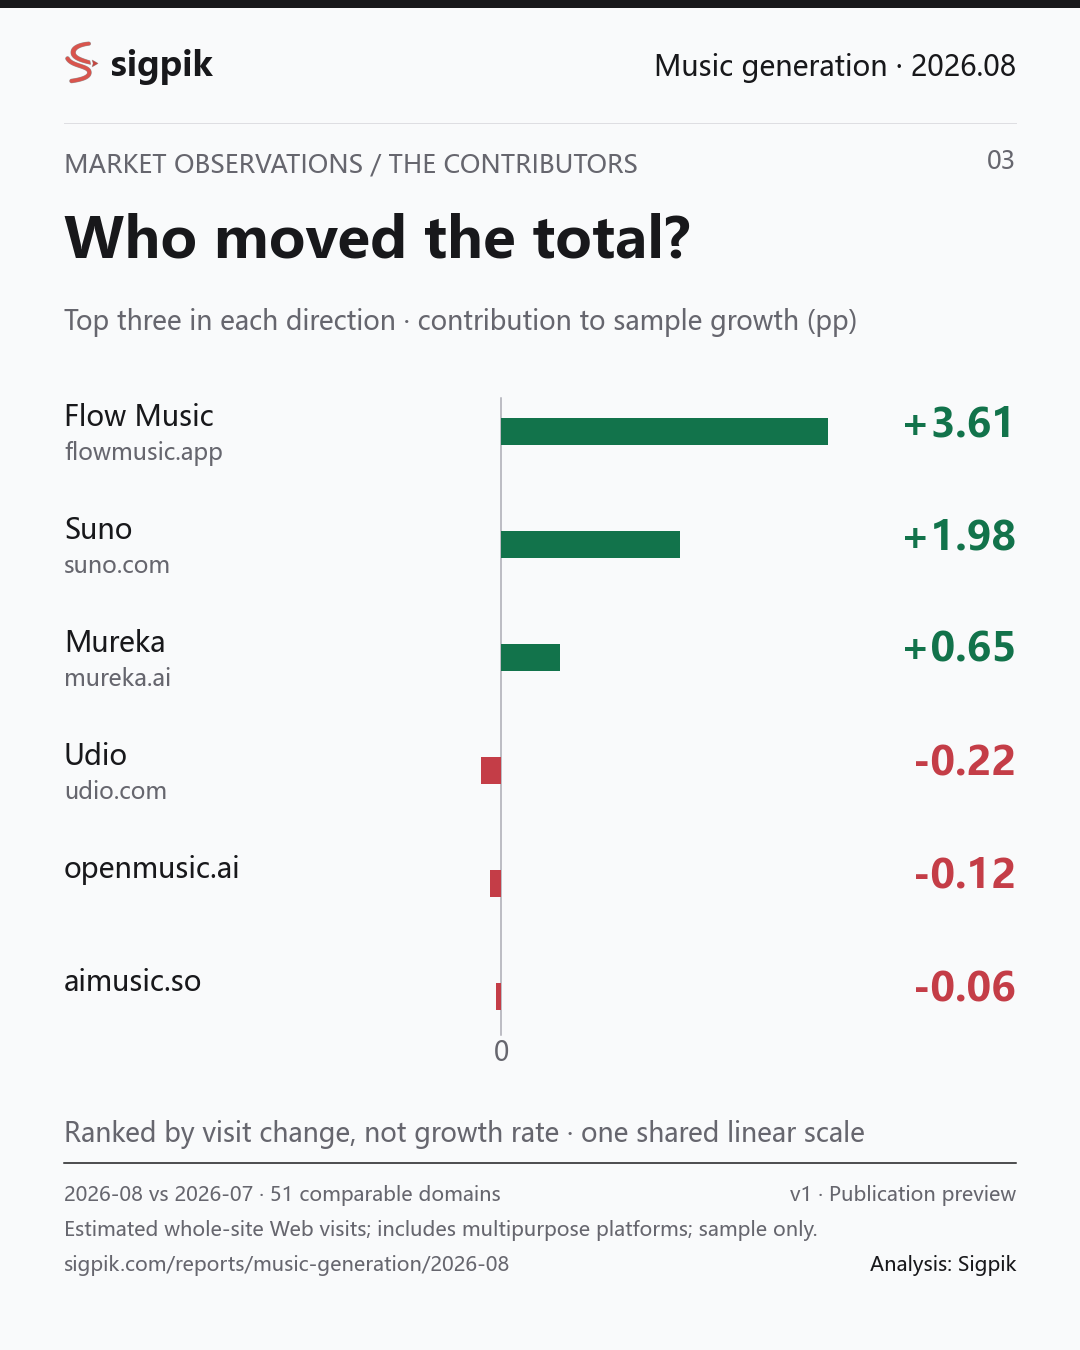
Top three in each direction by absolute visit change; pp indicates contribution to overall sample growth in percentage points.
Largest positive contributions
- Flow Musicflowmusic.app+3,174,1703,017,770 → 6,191,940+105.2% · +3.61 pp
- Sunosuno.com+1,741,05370,981,961 → 72,723,014+2.5% · +1.98 pp
- Murekamureka.ai+571,8252,600,087 → 3,171,912+22.0% · +0.65 pp
Largest negative contributions
- Udioudio.com-192,4671,352,988 → 1,160,521-14.2% · -0.22 pp
- openmusic.ai-103,6761,116,762 → 1,013,086-9.3% · -0.12 pp
- aimusic.so-50,733420,916 → 370,183-12.1% · -0.06 pp
Fastest growth · Previous-month visits ≥ 100,000
- writewithchorus.com+123,853103,381 → 227,234+119.8% · +0.14 pp
- Flow Musicflowmusic.app+3,174,1703,017,770 → 6,191,940+105.2% · +3.61 pp
- mozartai.com+142,928154,773 → 297,701+92.3% · +0.16 pp
Whole-site visits may include activities outside this category.
03 / TREND AND BREADTH
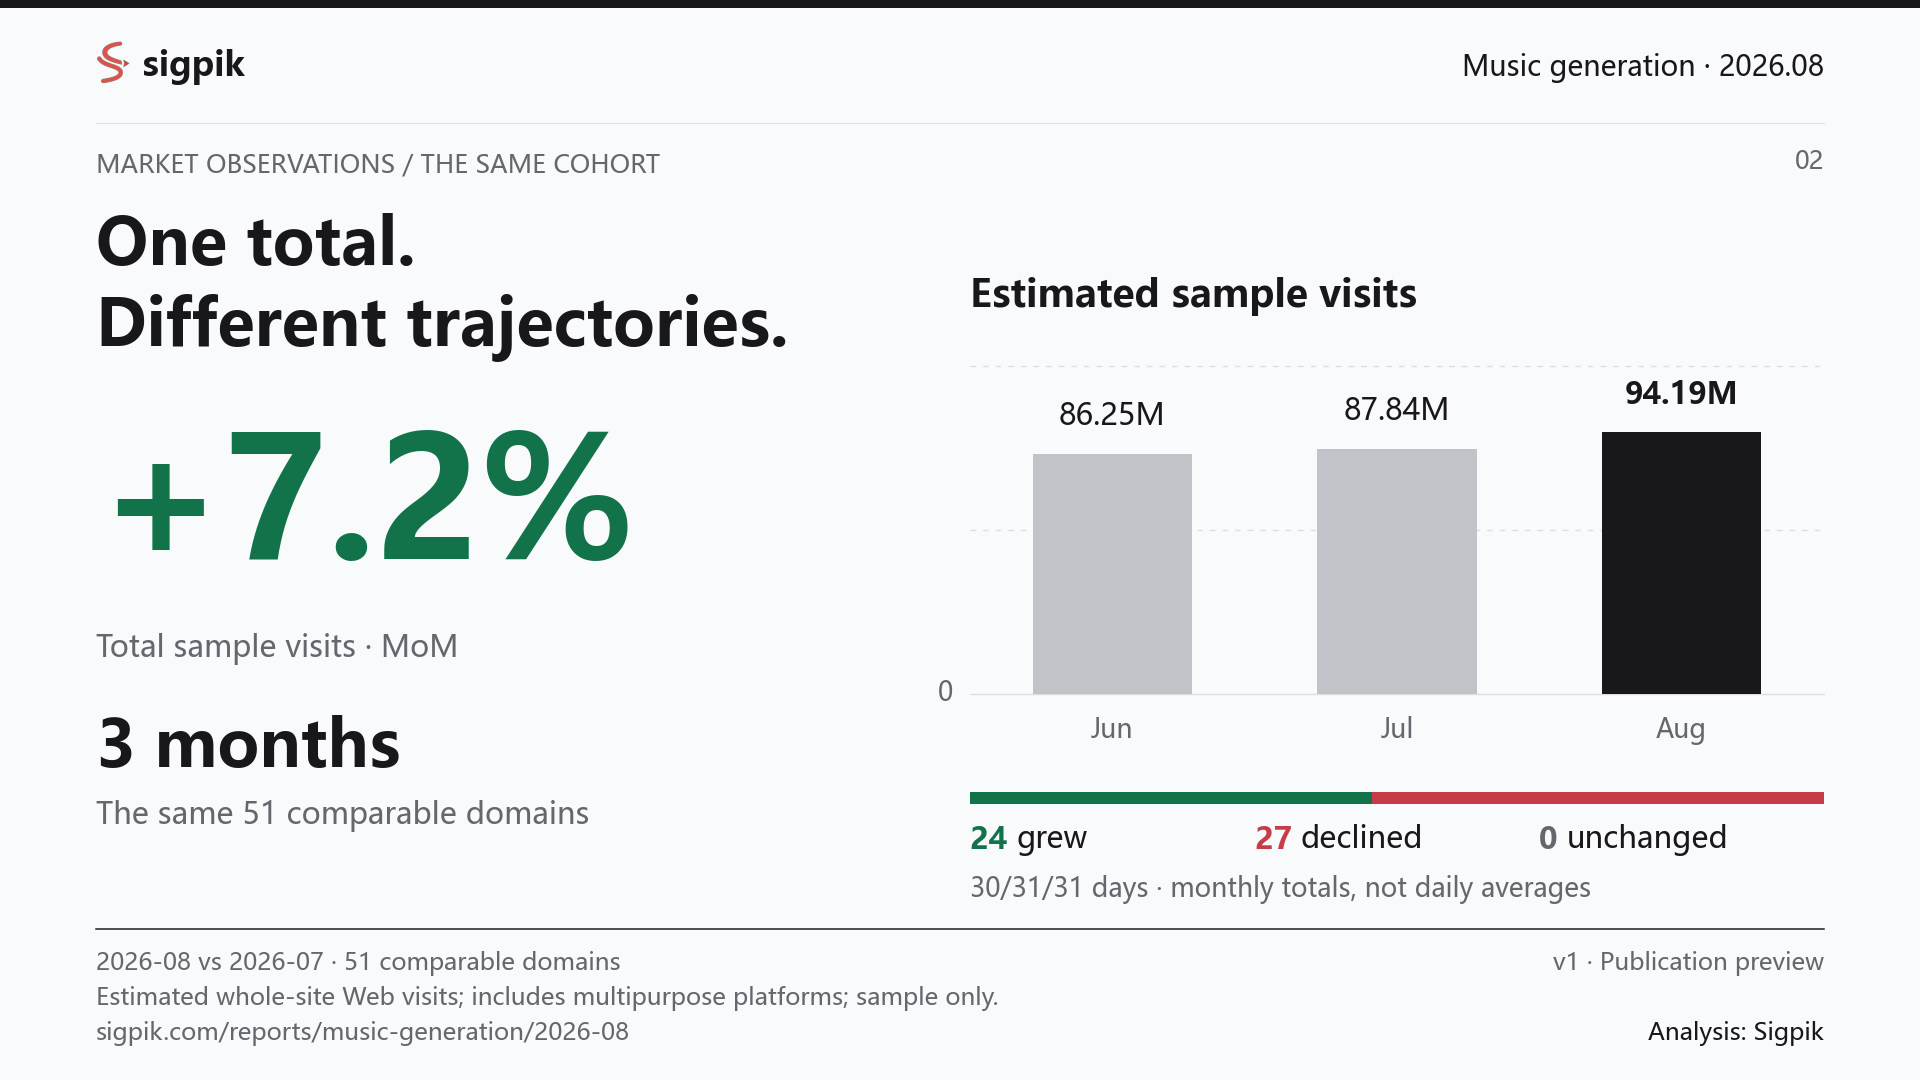
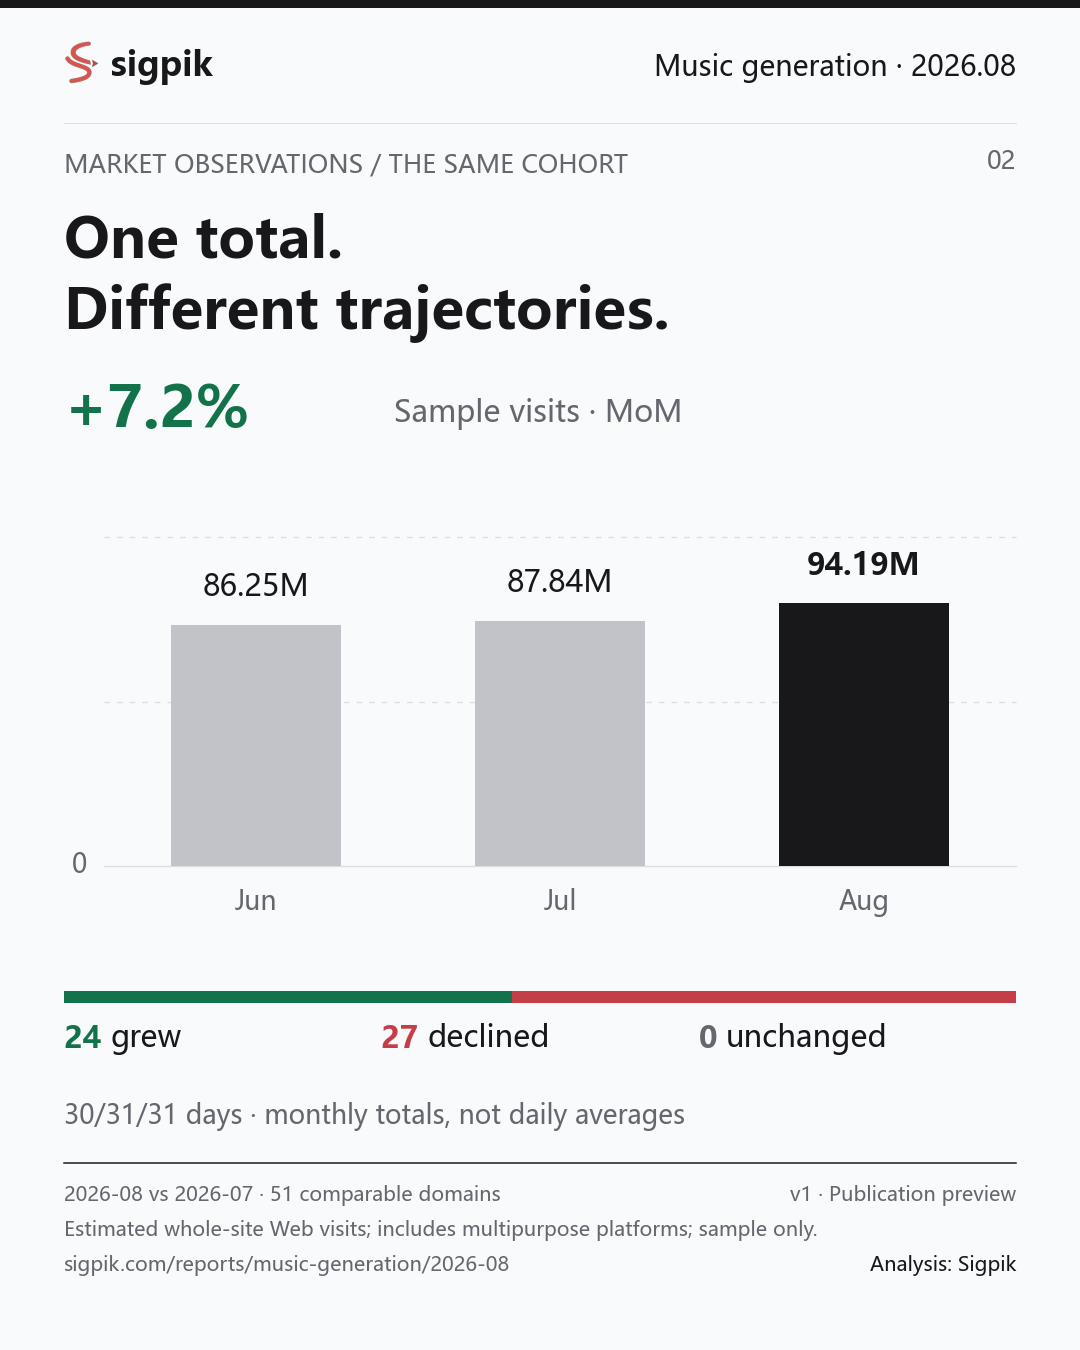
27 samples declined; 24 grew
Sample visits · 3 months
Same 51 domains each month. 2026-06: 30 days;2026-07: 31 days;2026-08: 31 days。Nonzero vertical baseline, in millions of visits.
Growth, decline and unchanged
Median sample growth was -7.4%. Aggregate growth reflects platform size; the distribution and median show how individual samples changed.
Direction follows the sign of the change in unrounded estimated visits; unchanged means exactly equal in both months. Small changes count toward direction, without implying statistical significance. Missing values are not treated as zero.
View all 51 comparable domains
| Domain | 2026-07 | 2026-08 | Change | MoM |
|---|---|---|---|---|
| suno.com | 70,981,961 | 72,723,014 | +1,741,053 | +2.5% |
| flowmusic.app | 3,017,770 | 6,191,940 | +3,174,170 | +105.2% |
| mureka.ai | 2,600,087 | 3,171,912 | +571,825 | +22.0% |
| treblo.com | 1,542,545 | 1,878,060 | +335,515 | +21.8% |
| musci.io | 890,489 | 1,190,361 | +299,872 | +33.7% |
| udio.com | 1,352,988 | 1,160,521 | -192,467 | -14.2% |
| openmusic.ai | 1,116,762 | 1,013,086 | -103,676 | -9.3% |
| brev.ai | 581,096 | 695,755 | +114,659 | +19.7% |
| aisongmaker.io | 663,943 | 682,370 | +18,427 | +2.8% |
| aimusicgen.ai | 377,962 | 599,861 | +221,899 | +58.7% |
| makebestmusic.com | 432,479 | 507,389 | +74,910 | +17.3% |
| tunee.ai | 529,481 | 489,548 | -39,933 | -7.5% |
| aimusic.so | 420,916 | 370,183 | -50,733 | -12.1% |
| musicfy.lol | 330,117 | 301,714 | -28,403 | -8.6% |
| mozartai.com | 154,773 | 297,701 | +142,928 | +92.3% |
| mubert.com | 286,530 | 265,245 | -21,285 | -7.4% |
| soundraw.io | 237,404 | 246,642 | +9,238 | +3.9% |
| sfxengine.com | 254,963 | 234,495 | -20,468 | -8.0% |
| writewithchorus.com | 103,381 | 227,234 | +123,853 | +119.8% |
| musichero.ai | 247,756 | 216,162 | -31,594 | -12.8% |
| songai.io | 123,750 | 210,377 | +86,627 | +70.0% |
| beatoven.ai | 197,592 | 186,428 | -11,164 | -5.7% |
| musicmaker.im | 160,797 | 175,999 | +15,202 | +9.5% |
| sunoprompt.com | 154,287 | 159,320 | +5,033 | +3.3% |
| airmusic.ai | 164,099 | 149,204 | -14,895 | -9.1% |
| tunesona.com | 134,557 | 121,304 | -13,253 | -9.8% |
| tempolor.com | 122,468 | 110,429 | -12,039 | -9.8% |
| song-lyrics-generator.org.uk | 100,662 | 103,871 | +3,209 | +3.2% |
| textsong.ai | 80,221 | 88,426 | +8,205 | +10.2% |
| melodycraft.ai | 100,193 | 76,166 | -24,027 | -24.0% |
| musick.ai | 51,899 | 51,927 | +28 | +0.1% |
| staccato.ai | 40,370 | 47,642 | +7,272 | +18.0% |
| musicfx.net | 50,913 | 44,054 | -6,859 | -13.5% |
| vibemusicing.com | 45,294 | 38,588 | -6,706 | -14.8% |
| aisinging.ai | 44,298 | 34,789 | -9,509 | -21.5% |
| lemonaide.ai | 31,713 | 33,967 | +2,254 | +7.1% |
| meloflow.ai | 18,246 | 15,315 | -2,931 | -16.1% |
| theselyricsdonotexist.com | 16,931 | 12,684 | -4,247 | -25.1% |
| melodusk.ai | 8,327 | 12,529 | +4,202 | +50.5% |
| musid.ai | 20,324 | 11,488 | -8,836 | -43.5% |
| gensong.ai | 11,140 | 9,344 | -1,796 | -16.1% |
| extendmusic.ai | 14,824 | 9,169 | -5,655 | -38.1% |
| geminimusic.studio | 4,080 | 4,766 | +686 | +16.8% |
| rhyme.cool | 3,269 | 4,324 | +1,055 | +32.3% |
| chordcreate.com | 3,636 | 3,354 | -282 | -7.8% |
| sunoi.io | 1,172 | 3,060 | +1,888 | +161.1% |
| ecrettmusic.com | 4,626 | 2,693 | -1,933 | -41.8% |
| app.songr.ai | 3,313 | 2,295 | -1,018 | -30.7% |
| musicstar.ai | 1,789 | 913 | -876 | -49.0% |
| audino.ai | 1,212 | 701 | -511 | -42.2% |
| automusic.ai | 2,317 | 680 | -1,637 | -70.7% |
04 / MEDIA RESOURCES
Copy the findings. Take the charts.
No sign-in required. All downloads use the same edition and methodology as this report.
Exported charts are light-background PNGs for articles and reports. Landscape: 1920×1080; portrait: 1080×1350.
Reuse and attribution
Charts, estimated visit counts and downloadable domain data in this edition may be quoted, republished and redistributed. Retain Sigpik attribution, reporting period, sample scope, version and the original edition link; identify adaptations or excerpts. Estimated visits are not unique users or industry totals.
According to Sigpik Market Observations, estimated Web visits across 51 comparable domains rose 7.2% in August 2026. 24 growing domains added 6,964,010 visits; 27 declining domains lost 616,733 visits, for a net gain of 6,347,277 visits.
According to Sigpik Market Observations, Flow Music's estimated Web visits rose 105.2% in August 2026, adding 3.17 million visits and contributing +3.61 percentage points to sample growth.
According to Sigpik Market Observations, Suno accounted for 77.2% of estimated sample Web visits in August 2026. Excluding that domain in both months, visits across the remaining 50 domains rose 27.3%. Median growth across all 51 domains was -7.4%.
Includes 6 PNGs, summary.csv, cohort.csv, coverage.json, citation.txt and README.txt. Retain Sigpik attribution, period, sample scope and the edition link when citing.
Get the Sigpik monthly research brief →
Coverage in this edition
The candidate set contains 58 domains; 51 meet the two-month comparison rules and 7 are excluded by data conditions.
Supplemental samples and inclusion evidence
The original category snapshot contains 57 domains. 1 product(s) assigned to a parent category were added using the same two-month validation and fixed-cohort history rules.
- suno.com — Official product scope checked 2026-09-14
Comparable samples account for 100.000% of observed current-month visits in the candidate set. This is not 100.000% coverage of the entire market.
- Missing valid current-month visits. 0 domains
- Missing valid previous-month visits. 0 domains
- Zero previous-month visits; comparable growth cannot be calculated. 7 domains
Required-domain coverage checks
This limited checklist prevents known important domains from being silently omitted; it is not an exhaustive market roster.
- suno.com:Included in the comparable cohort
- flowmusic.app:Included in the comparable cohort
- mureka.ai:Included in the comparable cohort
- udio.com:Included in the comparable cohort
Product scope notes
This cohort covers music-related platforms, including lyrics, prompts and sound effects; not every domain is a dedicated song generator. Notes describe official pages on the check date, not historical feature availability.
- sunoprompt.com:Offers music generation alongside prompt and lyric tools. (2026-09-14)
- theselyricsdonotexist.com:Provides generated song lyrics. (2026-09-14)
- rhyme.cool:Generates rap and song lyrics. (2026-09-14)
- sfxengine.com:Generates sound effects and custom audio. (2026-09-14)
Samples follow a category snapshot, not an exhaustive market roster. Multipurpose platforms use whole-site visits; absence does not mean zero traffic or exclusion from the market.
05 / METHODOLOGY
How to read these numbers
Data compilation and analysis: Sigpik Market Observations. Third-party estimates for covered music-related platforms are deduplicated by domain. Figures represent worldwide whole-site Web visits, including multipurpose platforms; they do not separately measure app, API or off-site use and are not unique users.
Comparable samples, calculations and ranking rules
- Comparable samples: 51 domains with valid visits in both months and a positive baseline. Historical trends use the same domains.
- Overall growth = sum of current visits / sum of previous visits − 1. Median growth uses individual domain growth rates.
- Contribution = domain visit change / previous sample total × 100, in percentage points. Main lists rank visit change; the growth list requires at least 100,000 previous-month visits.
- Top-three share uses each month’s three largest domains. Top-three visit growth compares the current top three across both months.
- Shares are within the sample. A single month cannot establish revenue changes or competitive causality. Cohorts may change between editions; catalog additions do not recalculate historical editions.
Prepared: 2026-09-14 · Version: v1 · Publication preview。Published editions stay fixed; corrections retain the original version and a visible explanation.