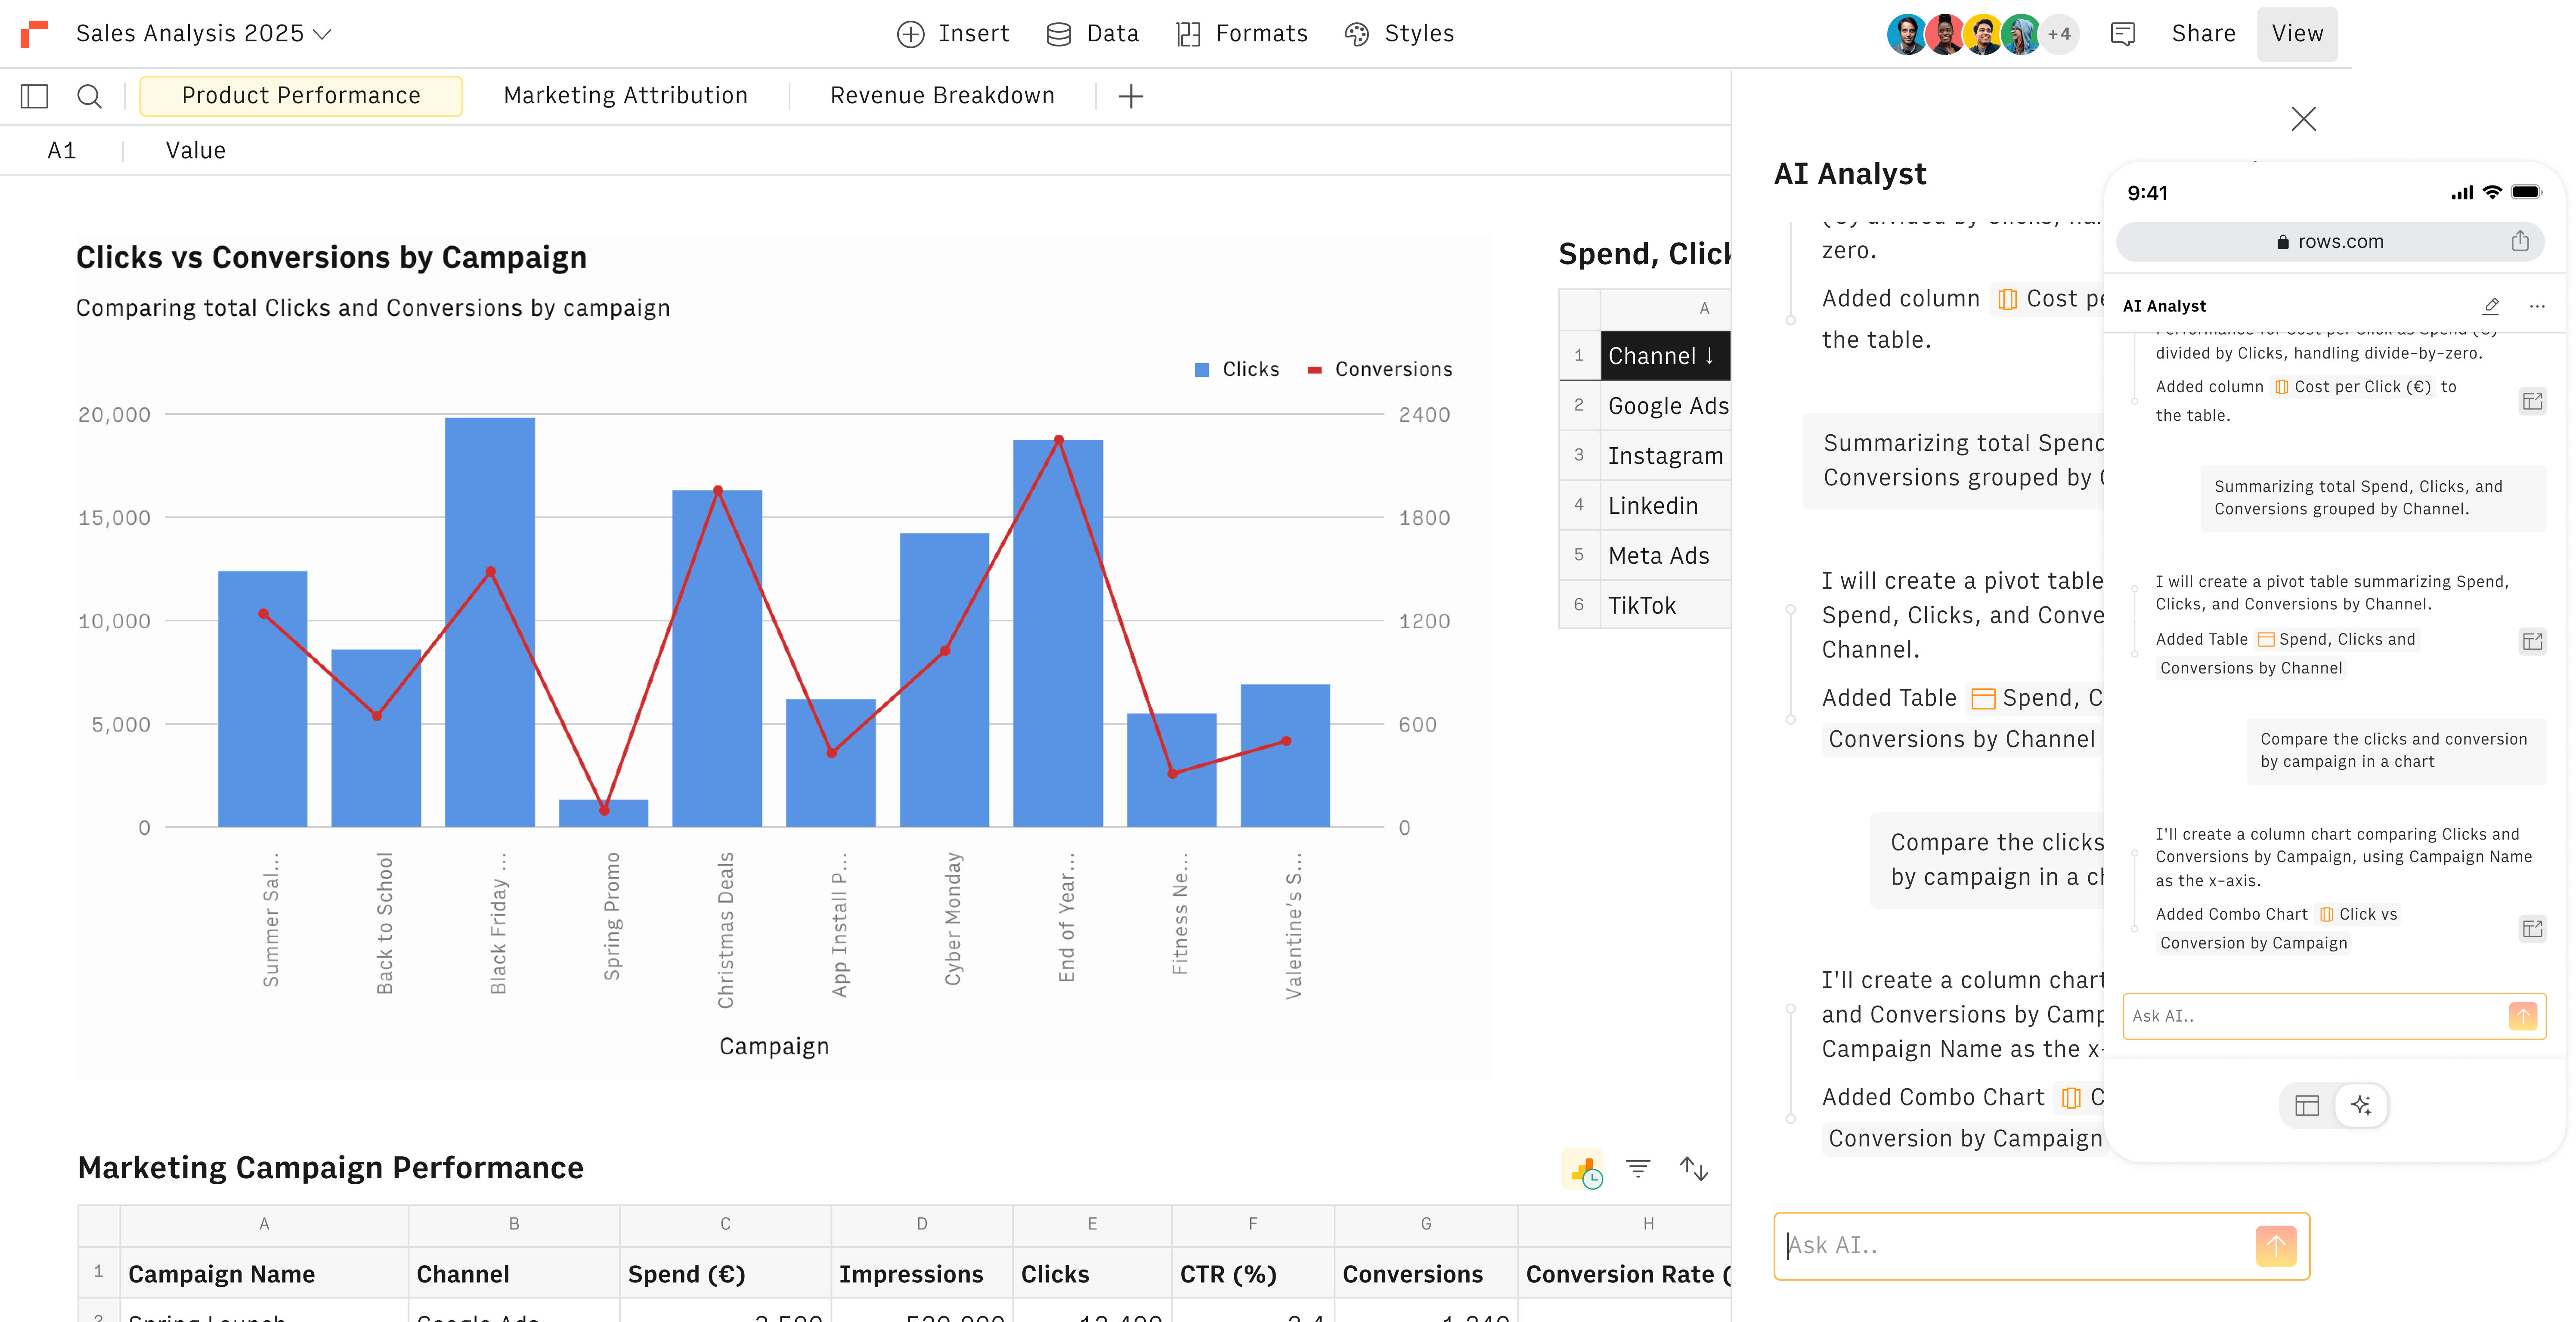
Use AI to analyze data from 50+ sources — PDFs, databases, analytics tools, and bank accounts. Only plain language. No code, SQL, or formulas.
AI Data AnalystDashboard Generatordata-analysisDomain age: 27 years 6 monthsLast observed: Sep 15, 2026
Product profile, website snapshot & milestones
Product profile
rows.com
About the product
Use AI to analyze data from 50+ sources — PDFs, databases, analytics tools, and bank accounts. Only plain language. No code, SQL, or formulas.
Capabilities
AI Data Analyst
Dashboard Generator
data-analysis
Data Extraction
Data Transformation
Data Visualization
Natural Language Query
PDF-to-Data
Report Generation
Spreadsheet Analysis
Web Data Extraction
Key features
Extract data from documents
Use AI to extract data from documents and business tools and build live reports.
Analyze data 10x faster
Stop wrestling with formulas and menus: tell AI what to do, and let it do the work.
Model from scratch
Ask AI to build dynamic models and calculators that behave like a spreadsheet.
Built-in integrations
Import data from social media, data warehouses, advertising platforms, your back-office platform, and other tools you use every day, all without writing code.
Always in sync
Refresh data automatically. Every minute or every month, put it on autopilot.
One view, many sources
Combine live data from 50+ sources in a flexible spreadsheet you control to build the report you need.
Distribution snapshot only; channel shares are not a campaign event or a claim of growth causality.
03
Competitors
Competitor comparison
Reviewed alternatives appear first, followed by products in the same market. Observation months are shown per row; different months do not form a same-period ranking.
Findings are based on retrievable public records, with evidence gaps made explicit. Scope and completion time depend on available sources.
Unlock this product’s promotion research & launch action pack
Review launch channels, backlink evidence and marketing milestones, then export your action checklist. A one-off purchase includes permanent access and regeneration for this product.