Market report · Video & Animation
AI Video in August 2026: What Will Customers Pay For?
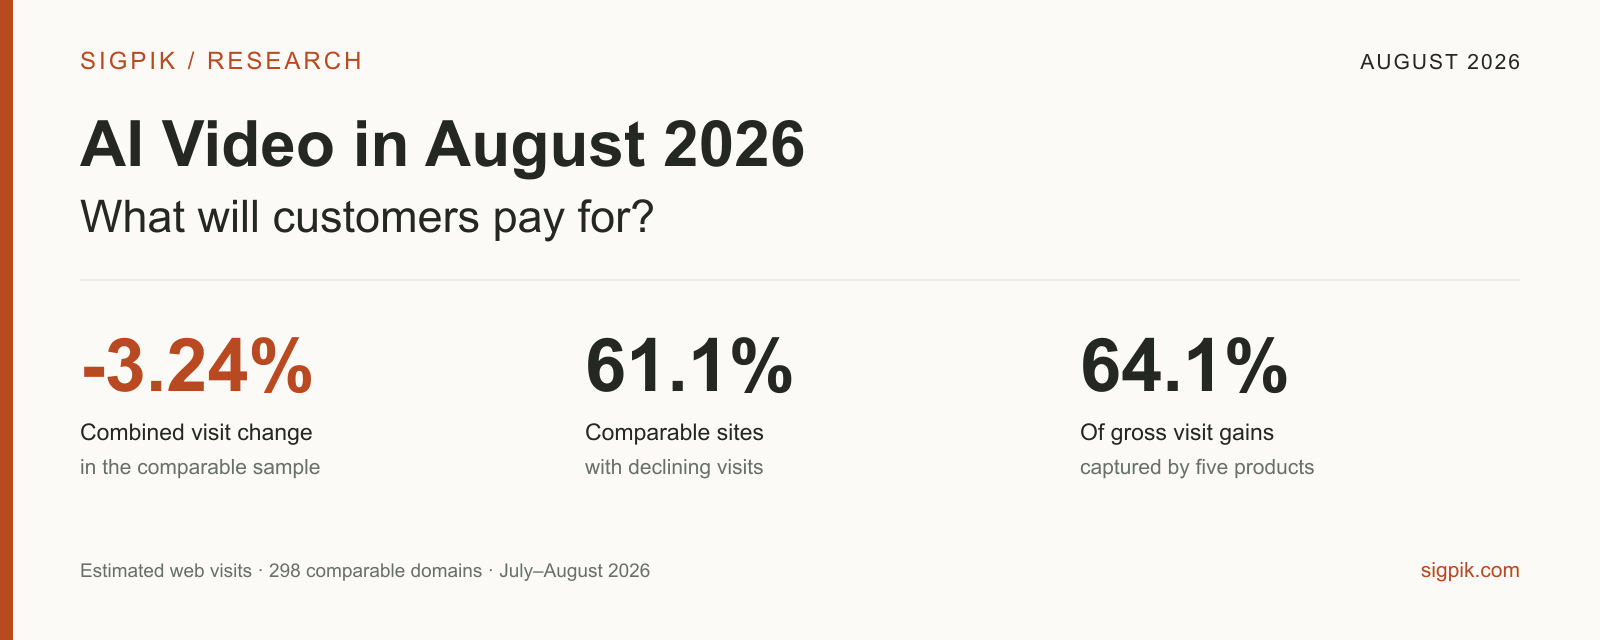
Visits to comparable video and animation websites fell 3.24% in August, while five products captured 64.1% of all gains. Explore eight segments, five product case studies and practical opportunities for SaaS builders to turn generated clips into work customers can use.
Key takeaways
- Growth was uneven. The 298 comparable websites recorded about 200 million August visits, down 3.24% from July. Visits fell at 182 of them, or more than six in ten. Being in AI video was no guarantee of growth.
- A few products captured most of the gains. The top five accounted for 64.1% of all positive visit changes. DaVinci's paid-search-heavy traffic, AKOOL's creator challenge and VMEG's organic-search presence suggest different acquisition strategies, with different costs to investigate.
- Test the work that comes after generation. Maintaining multilingual videos, adapting product footage for different formats and delivering repeatable videos for one industry are practical starting points. Treat them as opportunities to validate with paying customers, rather than proven demand.
01 Market pulse: growth was far from universal
More than six in ten comparable websites lost visits in August. For a new team, the useful question is less about how to attract a first trial and more about which recurring job will bring a customer back.
The snapshot contains August observations for 345 websites spanning generation, editing, avatars and translation, totaling about 200 million global web visits. The month-to-month comparison uses only the same 298 domains with a positive July baseline, so new directory entries do not inflate the growth figure.
The same websites over time: a smaller audience than in April
Switch between a fixed five-month sample and the larger July–August comparison.
View exact values and sample size
| Month | Visits | Domains in sample |
|---|---|---|
| 2026-04 | 126,593,332 | 200 |
| 2026-05 | 122,584,451 | 200 |
| 2026-06 | 113,199,411 | 200 |
| 2026-07 | 119,260,478 | 200 |
| 2026-08 | 116,371,284 | 200 |
02 Market structure: big destinations, smaller workflow openings
Higgsfield accounted for 16.1% of observed August visits. The top ten together held 54.2%, leaving 45.8% spread across the rest. Large destinations attract substantial attention, but that does not tell us which specific customer tasks they serve well.
Traffic share measures attention at a website, not model quality. Platforms such as Higgsfield, Kling AI and DaVinci also offer image or other creative features. Their whole-site totals should not be read as video-only usage.
August visit share: the top ten and the rest
| Product | Visits | Observed share | Monthly change | Share change |
|---|---|---|---|---|
| Higgsfield | 32,138,314 | 16.07% | +2.6% | +0.92 pp |
| Kling AI | 11,703,445 | 5.85% | -6.4% | -0.20 pp |
| HeyGen | 10,038,702 | 5.02% | -5.8% | -0.13 pp |
| DaVinci | 9,055,750 | 4.53% | +34.2% | +1.26 pp |
| OpenArt | 8,861,371 | 4.43% | +0.3% | +0.16 pp |
| VEED | 8,474,118 | 4.24% | -7.6% | -0.20 pp |
| Pollo AI | 8,285,652 | 4.14% | +1.9% | +0.21 pp |
| Dreamina | 7,035,489 | 3.52% | -30.3% | -1.37 pp |
| invideo AI | 6,490,749 | 3.25% | -5.2% | -0.07 pp |
| A2E AI | 6,277,982 | 3.14% | +0.6% | +0.12 pp |
03 Segments: a rising category can hide weaker peers
Avatar and lip-sync visits rose 27.8% overall. Remove AKOOL, however, and the remaining comparable sites fell 21.8% in aggregate. Translation also depended heavily on one product. A positive category headline can hide a much less encouraging picture underneath.
Separate a segment-wide opportunity from the performance of one successful product. In these data, the strongest category gains are heavily influenced by individual products, rather than a broad rise across their peers.
Segment size and monthly change
Eight segments: traffic, growth and concentration
| Segment | Leading product / share | Monthly / 3-month sample | |||||
|---|---|---|---|---|---|---|---|
| Video generation & conversion | 142,596,010 | -3.8% | -2.9% | 174 | 37.79% | Higgsfield / 22.54% | 148 / 140 |
| Content production & platforms | 28,381,875 | -1.1% | +2.4% | 53 | 56.23% | Pollo AI / 29.19% | 44 / 41 |
| Video editing | 20,763,373 | -4.9% | -2.8% | 51 | 48.42% | OpusClip / 24.85% | 46 / 45 |
| Avatars & lip sync | 3,059,033 | +27.8% | +21.3% | 27 | 71.44% | AKOOL / 54.25% | 24 / 24 |
| Animation & motion | 2,189,740 | -5.8% | +2.9% | 13 | 68.24% | Piskel / 41.69% | 12 / 12 |
| Subtitles, translation & dubbing | 2,010,383 | +3.6% | -0.2% | 21 | 52.14% | AI Dubbing / 19.64% | 19 / 19 |
| Video enhancement & restoration | 777,445 | -18.9% | -22.4% | 3 | 100.00% | [OFFICIAL] HitPaw VikPea - Best AI Video Enhancer Software for 4K/8K Upscaling / 99.63% | 2 / 2 |
| Video understanding | 162,879 | -21.3% | -7.6% | 4 | 100.00% | TwelveLabs / 86.97% | 3 / 3 |
The three-month change is cumulative from May to August. Concentration is calculated from visits within each segment. · 2026-08 · Snapshot 2026-09-28
04 Gains and losses: who moved the totals?
Growing sites added 7.14 million visits, while declining sites lost 13.84 million. The net result was a loss of 6.69 million. Gains were concentrated in a small group, so successful individual products should not be mistaken for a rising market overall.
DaVinci, AKOOL and Higgsfield recorded the three largest absolute gains. On the other side, Dreamina alone accounted for 22.2% of all lost visits. Understanding these movements requires looking at channel mix and product context, not just the change in a headline number.
Gross gains, gross losses and net change
Top five gainers
- DaVinci+2.31M32.27% of gross gains
- AKOOL+1.06M14.78% of gross gains
- Higgsfield+819.58K11.47% of gross gains
- Seedance AI+213.17K2.98% of gross gains
- Magiclight.AI+183.65K2.57% of gross gains
Top five decliners
- Dreamina-3.07M22.15% of gross losses
- Kling AI-806.61K5.83% of gross losses
- OpusClip-773.53K5.59% of gross losses
- VEED-695.48K5.03% of gross losses
- Media.io-674.77K4.88% of gross losses
05 Five products worth a closer look
These five cases combine traffic observations with available public evidence. Each card separates the finding from its interpretation and identifies what to check next.
SIGPIK EVIDENCE · 2026-08
DaVinci ↗
FINDING
August visits reached about 9.06 million, up 34.2% from July. Paid search represented 73.6% of visits.
- August visits
- 9,055,750 Estimated whole-site visits
- July visits
- 6,750,185 Same domain
- Paid search share
- 73.6% Share of visits attributed to search advertising
INTERPRETATION
DaVinci combines strong visit growth with a traffic mix dominated by paid search. Before trying a similar approach, estimate whether customer spending can cover both acquisition and generation costs. This is davinci.ai, not Blackmagic Design's DaVinci Resolve editing software.
Interpretation confidence: Medium · The snapshot supports the visit increase and paid search share. It does not reveal ad spend, paid conversion or return on advertising, so it cannot prove the growth was profitable.
WATCH NEXT
Track changes in paid search share and branded organic discovery to see whether the acquisition pattern persists.
Sigpik snapshot frozen on September 28, 2026; Similarweb estimates of global web visits. Visits are not revenue, unique users or video-feature usage. · 2026-08 · Snapshot 2026-09-28
SIGPIK EVIDENCE · 2026-08
AKOOL ↗
FINDING
August visits reached about 1.66 million, up roughly 175% from July.
- August visits
- 1,659,532 Monthly visits to the same domain
- July visits
- 603,505 Baseline for the monthly comparison
- Social traffic share
- 4.8% Describes channel mix; does not attribute visits to one campaign
INTERPRETATION
AKOOL announced a creator challenge with $300,000 in rewards in early August, the same month its visits rose sharply. The campaign is a plausible lead to investigate, but coinciding in time does not show how much traffic it generated. A temporary surge also says little about whether participants will become repeat customers.
Interpretation confidence: Medium · The announcement establishes that the challenge existed. Monthly visits do not provide campaign attribution, participant retention or subsequent subscription renewals.
WATCH NEXT
After the challenge ends, compare September and October visits. Check participant retention only if suitable customer data becomes available.
AKOOL creator challenge announcement ↗ · Page updated August 3, 2026
Sigpik snapshot frozen on September 28, 2026; Similarweb estimates of global web visits. Visits are not revenue, unique users or video-feature usage. · 2026-08 · Snapshot 2026-09-28
SIGPIK EVIDENCE · 2026-08
VMEG ↗
FINDING
August visits reached about 364,000, up 63.1% from July. Organic search accounted for 45.4% of visits.
- August visits
- 364,048 Estimated website visits
- July visits
- 223,147 Same domain
- Organic search share
- 45.4% Visits from unpaid search results
INTERPRETATION
VMEG's translation workflow includes review, timing adjustments and delivery in multiple languages. Alongside its organic search presence, this makes it a useful lead for investigating task-specific demand. Neither the channel mix nor the feature list tells us how many visitors become paying customers.
Interpretation confidence: Medium · The traffic snapshot and vendor documentation support the observations. Search intent, customer retention and paid conversion have not been independently measured here.
WATCH NEXT
Examine relevant landing pages and search queries, then interview teams about their budget and update frequency for multilingual videos.
VMEG translation workflow overview ↗ · Page updated August 18, 2026; vendor description
Sigpik snapshot frozen on September 28, 2026; Similarweb estimates of global web visits. Visits are not revenue, unique users or video-feature usage. · 2026-08 · Snapshot 2026-09-28
SIGPIK EVIDENCE · 2026-08
Higgsfield ↗
FINDING
The largest destination in the sample recorded 32.14 million August visits, up 2.6% from July.
- August visits
- 32,138,314 Includes features beyond video
- July visits
- 31,318,735 Same domain
- Direct traffic share
- 58.8% May include typed URLs, bookmarks and unidentified referrers
INTERPRETATION
Higgsfield's 58.8% direct traffic share is consistent with a well-known destination, but it is not a retention rate. Its modest monthly gain also cannot establish a ceiling for AI video demand. A new entrant should test its own reasons for repeat use rather than borrow the leader's traffic profile as a forecast.
Interpretation confidence: Medium · The estimates establish scale and channel mix within the sample. Whole-site visits include other creative features, so video-specific usage cannot be isolated.
WATCH NEXT
Follow its feature mix and web traffic as general-purpose models improve. Look for evidence of substitution before attributing any change to competitors.
Sigpik snapshot frozen on September 28, 2026; Similarweb estimates of global web visits. Visits are not revenue, unique users or video-feature usage. · 2026-08 · Snapshot 2026-09-28
SIGPIK EVIDENCE · 2026-08
Dreamina ↗
FINDING
August visits reached about 7.04 million, down 30.3% from July—a loss of more than 3.06 million visits.
- August visits
- 7,035,489 Subdomain observation
- July visits
- 10,101,054 Same measured destination
INTERPRETATION
Dreamina had the largest absolute decline in the sample. Cooling launch interest is one possible explanation, alongside changes in promotion, redirects or mobile use. The practical lesson is to investigate repeat use before treating a traffic spike as a durable customer base.
Interpretation confidence: Medium · The decline is reproducible within this dataset. The snapshot does not identify its cause or capture every route through which customers use the product.
WATCH NEXT
Compare later releases with subsequent traffic and check for domain consolidation or shifts into mobile apps.
Sigpik snapshot frozen on September 28, 2026; Similarweb estimates of global web visits. Visits are not revenue, unique users or video-feature usage. · 2026-08 · Snapshot 2026-09-28
06 Emerging demand: from a generated clip to a finished deliverable
Selected August updates focused on professional exports, reusable brand assets and review workflows. These are useful clues about the work around generation: getting a clip into an editor, keeping a brand consistent and preparing a result for delivery.
Runway added ProRes and PNG sequence exports on August 10, then brought project assets and Brand Kits into its Agent on August 11. HeyGen's August recap describes a real estate offering and professional service support; VMEG describes translation review and manual approval. These updates point toward workflow integration, though announcements alone do not show customer adoption or revenue.
In practical terms, a generated result needs to fit into the next person's tools, and approved assets need to be easy to reuse. For a builder, reliability at that handoff may be a more useful interview topic than another comparison of generation speed.
08 Opportunities: start with a recurring delivery problem
The three ideas below translate the evidence into small, paid experiments. Each starts with a specific customer task; none requires building a new foundation model or assuming a category-wide boom.
09 Founder lessons: understand each order before scaling
Before adding more models, define the deliverable, the revision limit and the cost of completing an order. Knowing what remains after acquisition, computing and human work gives you a firmer basis for deciding what to build next.
For paid-search-heavy products, ask whether customer spending can cover acquisition. For organic discovery, investigate the specific task behind the search. For creator campaigns, check what remains when the incentives end. A large visit increase is a starting point for questions, not a complete business case.
For each early order, record four things: what the customer paid, API and computing costs, time spent on manual corrections, and the number of revision rounds. Redo only the failed shots, reuse approved assets and agree on the scope. A clear delivery promise is easier to cost than unlimited generation.
10 Watchlist: what would change the picture?
Keep the sample comparable and check whether growth spreads, whether concentration falls and whether the apparent strength of avatars and translation survives removing their standout products.
Four questions we can check again
- Does growth spread to a majority of websites?
Current: 38.93 · Monitoring threshold: 50.00
If it exceeds half, also check whether a few large products still contribute most of the absolute gains.
- Do five products still capture most of the gains?
Current: 64.07 · Monitoring threshold: 50.00
A value below 50% would mean gains are more dispersed. Check the overall net change separately.
- Does avatar growth extend beyond AKOOL?
Current: -21.82 · Monitoring threshold: 0.00
If the aggregate turns positive, examine how many products grew and which customer tasks they serve.
- Do more translation products grow together?
Current: -4.15 · Monitoring threshold: 0.00
This separates one product's performance from a broader visit trend. It does not establish revenue growth.
These are Sigpik monitoring thresholds, not industry standards.
Methodology and sources
Scope: the main category and subcategories behind Sigpik's /markets/video-animation page. The September 28, 2026 snapshot contains 346 product records and 346 distinct observed domains. Of these, 345 have valid August visit observations and one is missing. This scope is broader than pure video-generation models.
Monthly comparison: 298 domains with valid August observations and positive July visits. The 47 domains with a zero July baseline are excluded from growth calculations; a zero baseline does not establish that a product is new. Missing observations are not treated as zero. Observed market size and monthly growth therefore use different, explicitly defined samples.
Longer trend: the same 200 domains have valid observations in every month from April through August and positive April visits. The 8.07% decline is the cumulative change between the endpoints, not an average monthly rate or a change for the entire market. Five observations span four monthly intervals.
Segments: classification follows Sigpik's primary-category snapshot at extraction, without manual reclassification by business model. Segment counts and visits reconcile with the overall sample. Three-month change is cumulative from May to August, using domains with positive May visits and valid August observations within each segment.
Channels and shares: Similarweb estimates of global web visits, measured by domain or subdomain. Direct visits are not retention; paid search share is not ad spend; organic search is not paid orders. Multiple sites can belong to the same company, so website shares are not independent company market shares.
Multifunction platforms are counted at whole-site level and may include image generation or editing. The directory does not cover every industry participant. Revenue, profit, mobile usage, paid conversion and customer retention were not observed and are not inferred from these totals.
Evidence: vendor announcements establish that a feature or campaign existed, not why traffic changed. HeyGen's recap was published in September and is used retrospectively to confirm August events. Geographic signals are omitted because no verifiable country baseline was available. Without search-volume or conversion evidence, emerging-demand and opportunity claims remain low-confidence hypotheses.
Versioning: prepared under market-intelligence-v2.1. The snapshot retains the observations, classifications, figures and evidence used in the report. Live product links may change, but they do not alter these historical numbers. This English edition adapts Chinese revision 2.2 while preserving its numerical evidence.
Sigpik Video & Animation market (live page) · Snapshot extracted September 28, 2026
AKOOL creator challenge announcement · Page updated August 3, 2026
Runway August product changelog · August 2026 entries only
HeyGen August recap · Published September 9, 2026; retrospectively confirms August events
VMEG translation workflow overview · Page updated August 18, 2026; vendor description